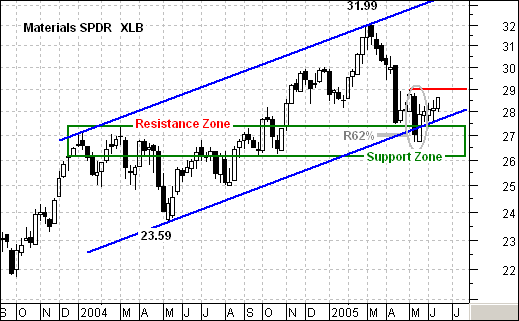
The Materials sector was all the rage in 2004, but fell on hard times in 2005. After a run from 23.59 to 31.99 (35%), the Materials SPDR (XLB) declined below 27 with a sharp decline. Was this enough to break the uptrend or is this just a sharp correction? The bulk of the evidence points to the latter.
Even though the decline was sharp and a classic corrective pattern failed to take shape, other technical signs point to a correction. First, the decline retraced around 62% of the prior advance. This Fibonacci number (percent) is normal for a correction. Second, the decline returned to broken resistance. Notice that the resistance zone around 26-27.5 turned into a support zone. This is also typical for a correction as there is often a throwback to broken resistance after the breakout. Third, the lower channel trendline confirms support around 27-28. I drew the upper trendline first and then based the lower trendline (parallel) on this upper trendline. The stock pierced the lower trendline, but quickly recovered and managed to stabilize over the last few weeks.
Stability is one thing, but a reversal is another. The stock formed a long black candlestick in May and then recovered the very next week (gray oval). A piercing pattern formed and this is a bullish candlestick reversal pattern. Confirmation is required though and I would look for a move above 30 to complete a reversal and expect a move higher.

