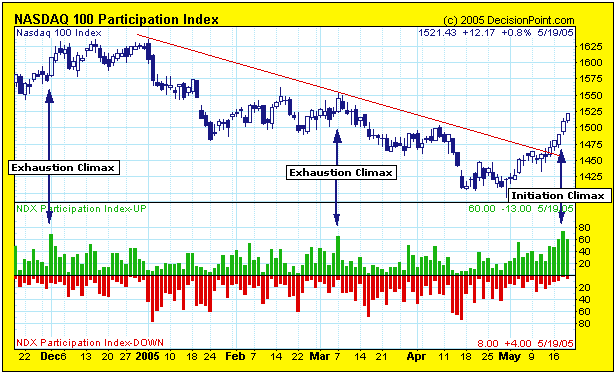
One of Decision Point's proprietary indicators is the Participation Index (PI). It measures extreme (climactic) activity within a short-term price envelope. When a large number of stocks are participating in a particular price move (up or down), we recognize that such high levels of participation are unsustainable and refer to it as a "climax".
There are two kinds of climaxes -- an initiation climax, which marks the beginning of a longer-term price move and an exhaustion climax, which marks the end of a price move. Both kinds of climax can be followed by some consolidation activity before the trend changes or continues.
On the chart I have marked three upside climaxes. With 20-20 hindsight we can easily conclude that the first two are exhaustion climaxes, but I have designated the last one, the highest PI reading in a year, as an initiation climax, although the jury is not in on that one yet. My reasons are that price has broken out above the declining tops line that has been in effect since January, and during May UP Participation has expanded significantly while DOWN Participation has contracted sharply.
While my annotations point out upside climaxes, there is a classic downside initiation climax on the second trading day of January. It is followed by two weeks of consolidation, then the down leg is completed with an exhaustion climax on January 24. The final selling climax for the four-month down trend doesn't occur until April 17.
Climactic indicator readings identify points at which the market is overbought or oversold, but they don't always mean that the trend is about to change directions. Currently, the market needs to correct its overbought condition, but it does not appear to be vulnerable to a reversal of trend.
