ChartWatchers February 19, 2005 at 11:05 PM
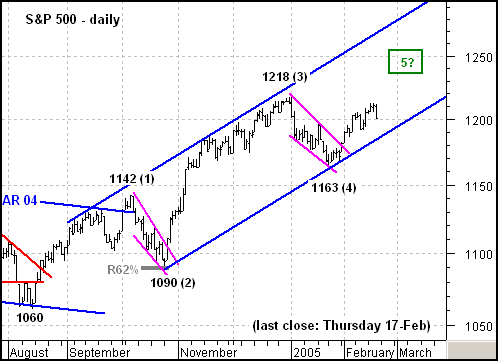
The S&P 500 remains in bull mode and continues to outperform the Nasdaq 100. In Elliott terms, the index has taken on a 5-Wave structure since mid August. Wave 1 extends up to 1142, Wave 2 declined to 1090, Wave 3 advanced to 1218 and Wave 4 fell to 1163... Read More
ChartWatchers February 19, 2005 at 11:04 PM
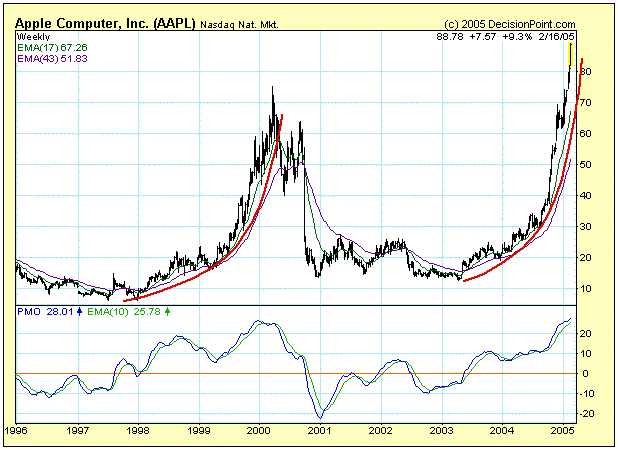
Investors love the Apple (AAPL) "story" and they are driving he stock's price into a vertical ascent. When a stock arcs into an ever-increasing angle of ascent it is called a parabolic rise... Read More
ChartWatchers February 19, 2005 at 11:01 PM
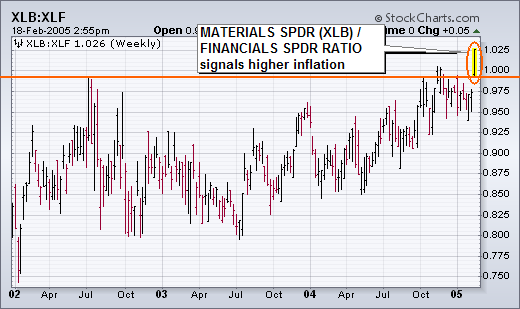
At the New York Expo last weekend, Martin Pring made the case that the battle between the forces of deflation and inflation had reached a critical inflection point. In other words, his charts showed that the deflation/inflation scale was about ready to tip in one direction... Read More
ChartWatchers February 19, 2005 at 11:00 PM
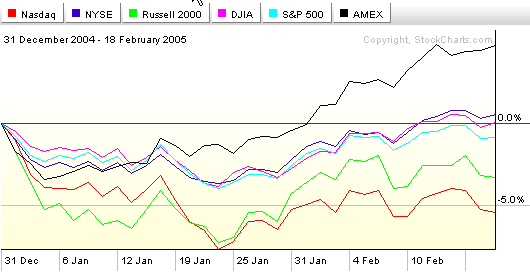
2005 is well underway now and some important technical trends are developing on the year-to-date charts. As you can see on this PerfChart, since the start of the year, the energy-heavy AMEX index has outperformed the other benchmarks significantly... Read More
ChartWatchers February 05, 2005 at 11:05 PM
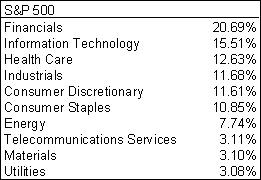
To understand the Nasdaq and Nasdaq 100, it is important to look at the individual parts. These two indices can be broken down into four key industry groups: semiconductors (SMH), networking (IGN), software (SWH) and internet (HHH)... Read More
ChartWatchers February 05, 2005 at 11:04 PM
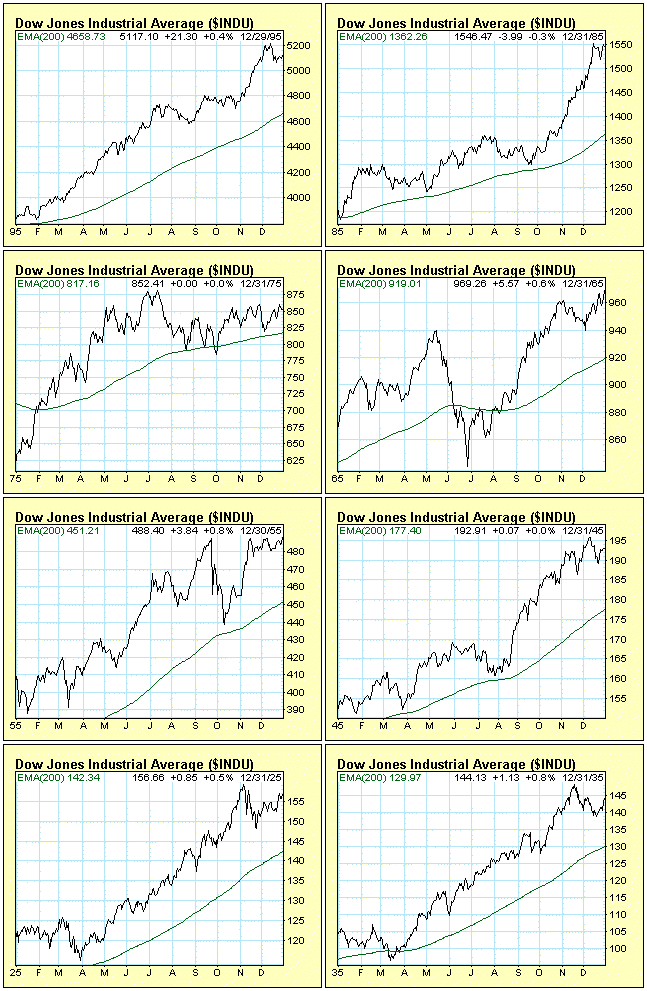
The Decennial Pattern refers to the fact that years ending in the number five (5) are up years for the stock market. This is not just a statistical tendency. In fact, this has been the case for every year ending in 5 since 1885... Read More
ChartWatchers February 05, 2005 at 11:03 PM
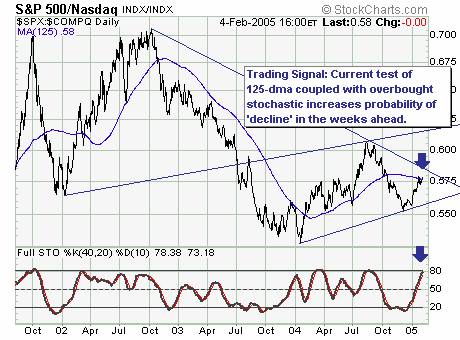
Last week's market rally was impressive to be sure. Now, the question whether the decline off the early January highs are in fact intermediate-higher or more short-term in nature... Read More
ChartWatchers February 05, 2005 at 11:02 PM
A "Beta" release is a preview / testing version of a new piece of software. We've received great feedback from our users about our previous four Beta versions of our new SharpCharts 2 charts. Now it's your turn. Check out the latest Beta version and let us know what you think... Read More
ChartWatchers February 05, 2005 at 11:01 PM
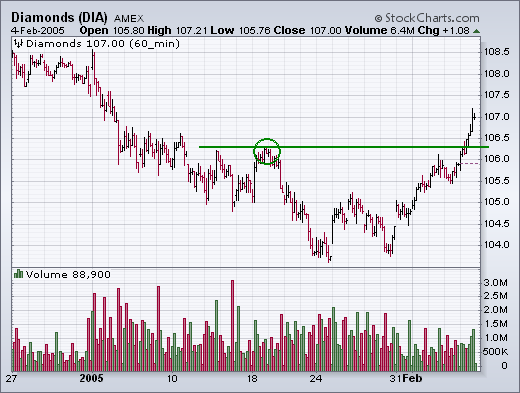
DOW AND S&P 500 CLEAR RESISTANCE BARRIER... The hourly bars for the Dow Diamonds and the S&P 500 SPDR show both having cleared initial resistance at their mid-January highs. [Both also closed back over their 50-day moving averages]... Read More
ChartWatchers February 05, 2005 at 11:00 PM
As you may have noticed, once again we are able to send out the newsletter in HTML format thanks to the good people at ConstantContact.com. We hope you enjoy the convenience of having the entire newsletter in your inbox rather than having to click a link to see it... Read More
ChartWatchers February 03, 2005 at 11:01 PM
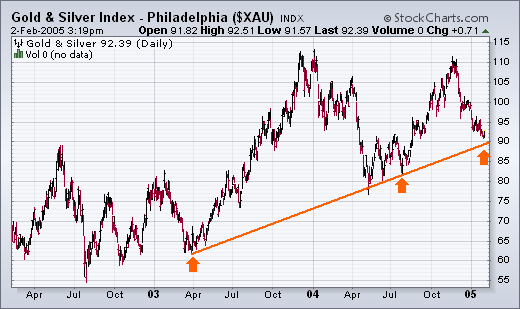
GOLD INDEX STILL TESTING TRENDLINE SUPPORT... Back on January 10, I wrote about the Gold & Silver Index (XAU) being in a support zone defined by the rising trendline shown in Chart 1. The trendline starts in April 2003 and is drawn under the April/July 2004 lows (see arrows)... Read More
ChartWatchers February 03, 2005 at 11:00 PM
Today we have a special mid-week edition of ChartWatchers for you. Yesterday, John Murphy published a column and the long term outlook for Gold and the Market as a whole... Read More