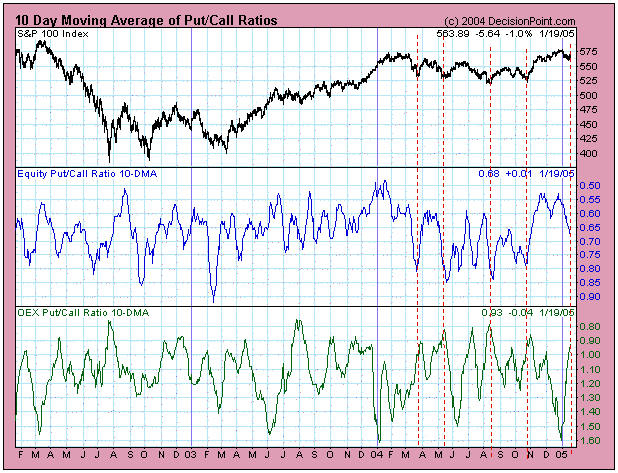
The Equity and OEX Put/Call Ratios generally signal overbought and oversold conditions that help identify price tops and bottoms; however, sometimes the OEX Put/Call Ratio will invert relative to the Equity Put/Call Ratio. At these times the inversion signals the opposite of what we would normally expect.
Here's how I think this works. The Equity P/C Ratio represents the activity of speculators (the little guys) who become more and more committed to price direction until it reverses on them, therefore the Equity P/C Ratio becomes oversold at price bottoms and overbought at price tops.
The OEX P/C Ratio reflects hedging activity by big money. These guys tend to lighten up as the price trend becomes more extreme, preparing for the inevitable reversal, so the OEX P/C Ratio can become overbought at bottoms and oversold at tops -- the opposite of what happens to the Equity P/C Ratio.

This is not always the case, but I have put red dotted lines on the chart to point out where these inversions have signaled price bottoms. Note that there is one very prominent inversion occurring now. Because the Equity P/C Ratio is oversold and prices have been declining, I think there is an excellent chance that the OEX P/C inversion is telling us that a price low is imminent.
My observation is that these signals can have short-term or intermediate-term implications, but there is no way to tell in advance.
