While it is widely reported when a stock is hitting a new 52-week high or low, I've always been curious as to where stocks are in relation to their 52-week range the rest of the time. To determine this I developed the "Rel to 52" scale. We simply assign a value between zero (at the 52-week low) to 100 (at the 52-week high). A stock in the middle of its 52-week range would get a Rel to 52 value of 50. This value is reported in one of the columns in our downloadable spreadsheets.
Decision Point also tracks the "Rel to 52" for each stock in certain market indexes, then we average them. The results make for an interesting indicator that give us a sense of how all the stocks are faring, not just the small percentage that are hitting the extremes of the one-year range. We have this indicator for the SPX, OEX, NDX, and Dow.

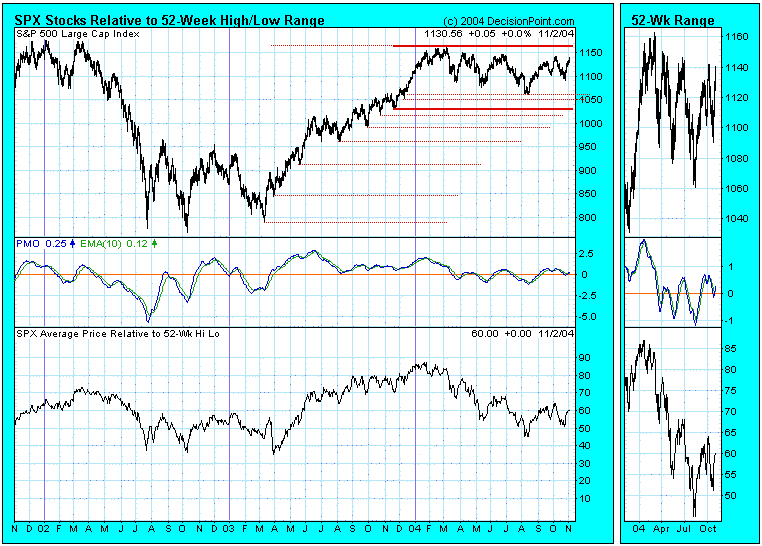
One of the things that stands out on this chart is the fact that, even in the depths of the bear market, the average Rel to 52 value was between 35 and 40, indicating that most stocks were not making new lows along with the S&P 500 Index. Conversely, notice how the Rel to 52 near the March 2004 market top was about 87, indicating that most stocks were participating in the rally.
The thing to remember is that the Rel to 52 is affected not only by up or down price movement, but also by the changing width of the 52-week range. For example, you can see how the range expanded in 2003 up to the March 2004 high, at which point the range was 375 points. Since then the bottom of the range has been rising along the higher lows of the 2003 portion of the bull market, and now the range is only 120 points wide. In the event of a longer-term price reversal, new lows would begin expanding rather quickly because the bottom of the range is relatively close.
While I have had my spreadsheets set to calculate and collect these data for several years, I had forgotten about it until just recently. There is probably more to learn from this chart as we study it and think about what we see, but it already offers a unique perspective on new highs and new lows.
