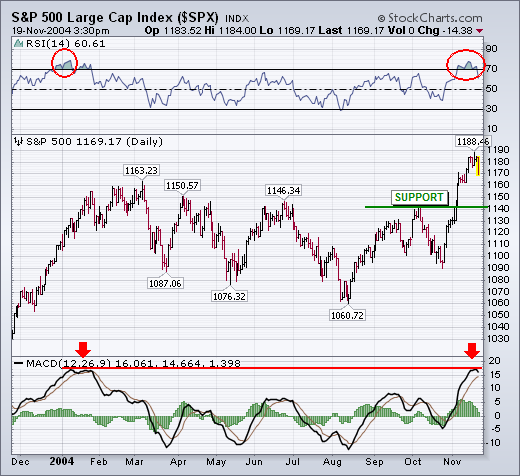
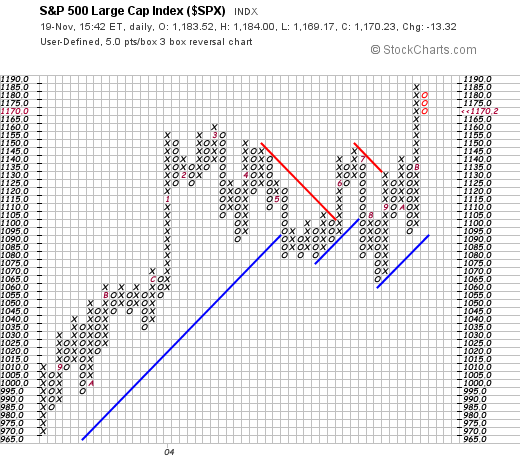
The daily chart for the S&P 500 for the last year pretty much tells the tale. The trend is still up. But its 14-day RSI line is in overbought territory for the first time since last January. Its daily MACD lines are also up against their early 2004 high. That being the case, and given today's negative intermarket trends, a pullback isn't too surprising. The key point is how much of a pullback do we need to start getting a little worried. One way to judge that is to look at where the previous peaks are. Working from the left side of the chart, that would put potential support points at 1163, 1150, and 1146 -- and the October peak at 1140, which may be the most important. That's because a pullback to 1140 would be a 50% retracement of the last upleg starting in late October and a 50% retracement of the entire upmove that started in August. As long as prices stay over that level, I'm not going to get too concerned. If it doesn't, I will. The point & figure boxes in Chart 2 also show that the S&P has suffered a three-box reversal into the down (o) column. That simply confirms that the market is entering a short-term pullback. So far, the p&f boxes don't show any serious trend damage.


