
Recently, the price of crude oil has taken the spotlight as having a major influence on the price of stocks. On the one-year chart above we can see that there was no consistent relationship between oil and stocks as long as oil was priced below $35; however, when oil moved above $35 in March, we begin to see a consistent negative correlation between oil and stocks.
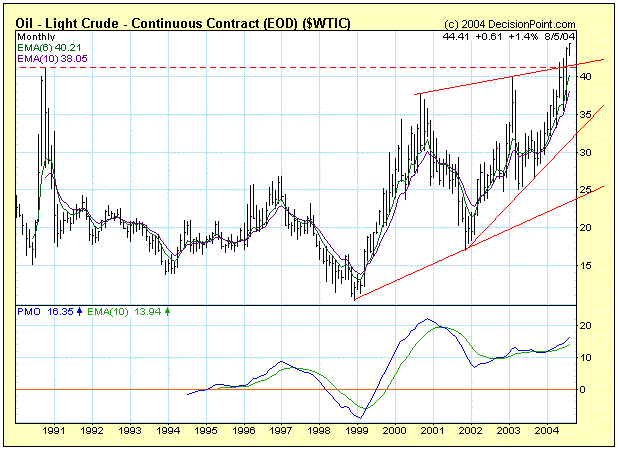
Long-term resistance for crude oil is around $41-42. When crude oil reached that level at the end of July, stocks attempted another rally, in anticipation that crude oil would turn down again at resistance. Once crude broke to new all-time highs, the short rally in stocks failed.
If crude prices continue to move higher, I think we should be alert for the possibility that there will be another disconnect in prices. Specifically, if the price of crude moves well above $42, short price declines may not translate directly to a rally in stocks because prices will still be too high. This is not to say that stocks can't rally, just that gyrations in the price of oil may not transmit directly to stocks.
For the record, I have no opinion regarding the price of oil. As you can see on the long-term chart, it has moved into uncharted territory and is above historical resistance levels. It could be headed for a major blowoff, or it may have moved permanently into the bottom of a new long-term trading range.
