Over the course of the past 4-months, price action in all of the indices have been "locked" within wide trading ranges. One question to be be answered is whether this is a "consolidation" to new highs; or a "distribution" to lower lows. If we had to answer this - we would suggest that against the fundamental backdrop of higher interest rates - the financial system has begun "DELEVERAGING" itself from the "carry trade" estimated to be $1.5 trillion. Therefore, we can conclude this trading range is a distribution formation...of which lower prices are developing.
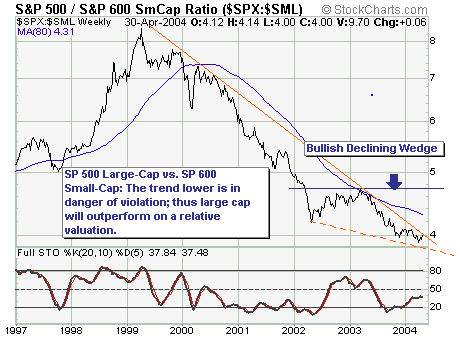
But just as importantly, we must look to "style type" decisions for trading, of which the ratio chart between the SP 500 Large Cap vs. SP 600 Small-Cap is locked within a clear downtrend. However, nascent signs are developing that the outperformance of the SP 600 is coming to a close in the intermediate-term. The ratio is on the verge of breaking above trendline resistance, which would then prompt a move into the 80-week moving average...and quite possibly the previous highs near 4.75. Be prepared.


About the author:
Chip Anderson is the founder and president of StockCharts.com.
He founded the company after working as a Windows developer and corporate consultant at Microsoft from 1987 to 1997.
Since 1999, Chip has guided the growth and development of StockCharts.com into a trusted financial enterprise and highly-valued resource in the industry.
In this blog, Chip shares his tips and tricks on how to maximize the tools and resources available at StockCharts.com, and provides updates about new features or additions to the site.
Learn More