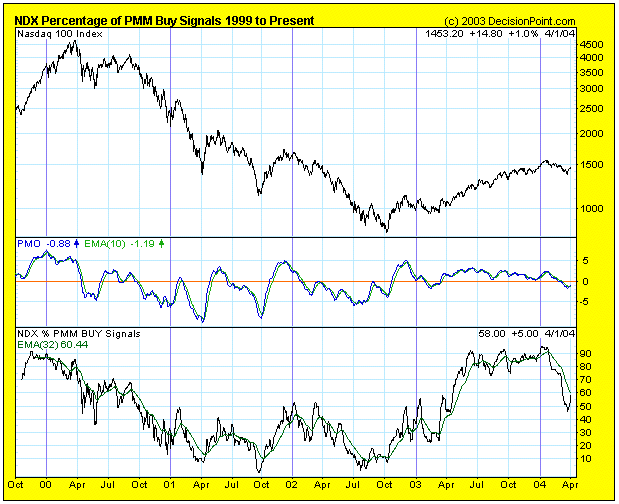
Does the world really need another indicator? Well, this is one we have been collecting data on for years, but we just recently started charting it because we discovered it presents a good picture of internal market strength or weakness.
Our Price Momentum Model (PMM) is a simple but effective mechanical model that we apply to all the stocks, indexes, and mutual funds we track. The PMM is always on a buy or sell, and it generates new signals when: (1) price moves 10% in the opposite direction of the signal extreme and (2) crosses the 200-EMA. For example, if the model is on a buy signal, a sell signal will be generated when the price index drops 10% from the highest price recorded during the buy signal and crosses down through the 200-EMA. (See http://www.decisionpoint.com/Glossary/PriceMomentumModel.html to learn more about the model.)
Since we track every stock in the Dow, Nasdaq 100, and S&P 500, we can calculate the percentage of the stocks on PMM buy signals. The resulting indicator is similar to the Bullish Percentage Index, which uses point and figure buy signals, but our PMM indicator tends to be a bit less volatile because a PMM signal change is harder to generate.
Currently, the indicator for the Nasdaq 100 (NDX) shows that considerable damage was done to the stocks in the index during the correction, as our indicator dropped below 50%; however, it is bouncing back nicely.
When the Percent PMM Buy index is above its 32-EMA, we generally consider the market environment to be positive because it shows a persistence in stocks being able to generate PMM buy signals. When it is below the 32-EMA, more caution is warranted, although it is possible for a market index to advance with only half its components participating (on PMM buy signals) because most indexes are capitalization weighted.
I think this indicator is most useful in evaluating the validity of major bottoms. If it can't move above its 32-EMA, it says the rally is not broad and is being led by a few large-cap stocks. Note how participation rose to over 90% within the first months of the 2003 bull market advance. This was also the case with the S&P 500, Dow, and the 112 Dow Jones US Sectors (which moved to 99%!).
