Archived News
Members Only
Martin Pring's Market Roundup3mo ago
Is The First Domino About to Fall for the Bitcoin Bull Market?
The Long-Term Picture No market goes up forever and, at some point, Bitcoin will top out. It's currently down about 12% from its peak, set on December 17 less than 4 weeks ago, so there is scant evidence at this point indicating a primary bear market Read More
ChartWatchers3mo ago

Inflation Sparks Stock Market Downturn: What This Means for Your Portfolio
What a difference a day makes! December ISM Services data suggests the service sector remains strong. The JOLTS report showed there were 8.09 million job openings in November — that's well above the 7.7 million that was expected Read More
Add-on Subscribers
OptionsPlay with Tony Zhang3mo ago
BEST Options Trading IDEAS This Week!
In this video, after a general market and sectors review, Tony shares the latest OptionsPlay trade ideas, including bullish and bearish ideas for GOOGL, NVDA, DIS, SHOP, and many more. He analyzes sector rotation with RRGs, and takes a look at key earnings Read More
ChartWatchers3mo ago

Which Top AI Semiconductor Stocks are Positioned for Growth?
On Tuesday, January 7, 2025, CES (Consumer Electronics Show) 2025 opens its doors in Las Vegas for a four-day event Read More
The Mindful Investor3mo ago

Rising Rates Suggest Weaker Stocks - Here's What I'm Watching!
In this video, Dave shares a long-term analysis of the Ten-Year Treasury Yield, breaks down how the shape of the yield curve has been a great leading indicator of recessionary periods and weaker stock prices, and outlines the chart he's watching to determine if early 2025 will lo Read More
DecisionPoint3mo ago

DP Trading Room: Does This Rally Have Legs?
In today's free DP Trading Room Carl and Erin discuss whether this market rally can get legs and push the market even higher? Mega-caps are looking very positive with the Magnificent Seven leading the charge. Technology is showing new strength along with Communication Services Read More
Art's Charts3mo ago

How to Trade Erratic Uptrends - An Example and Setup using IWM
The Russell 2000 ETF managed a double-digit gain in 2024, but did it the hard way with several deep pullbacks. Pullbacks within uptrends are opportunities and we can find such opportunities using %B. The chart below shows the Russell 2000 ETF (IWM) with the Zigzag(8) indicator Read More
The MEM Edge3mo ago

These Riskier Areas Start the New Year RALLY!
In this video, Mary Ellen analyzes the divergence between the S&P 500 and the Nasdaq while highlighting some of the areas driving Growth stocks. She also talks about the continuation rally in Energy and Utility stocks and shares which stocks are driving these areas higher Read More
ChartWatchers3mo ago

Stock Market Ends the Week Strong: Could It Spark a Bullish January?
Has it been a while since the broader market indexes closed in the green? It certainly seems that way. After what looked like a weak start to the new year, the stock market showed us it still had legs Read More
Trading Places with Tom Bowley3mo ago
These 3 Charts Are Among The Most Critical To Start 2025
Obviously, there will be many ups and downs in 2025 and no one chart or indicator can be relied upon 100% to help guide us throughout the year Read More
Add-on Subscribers
OptionsPlay with Tony Zhang3mo ago
Block and Loaded: Targeting Gains in SQ
As digital payments and fintech services continue to reshape the global economy, Block, Inc. (SQ) stands out as a potential beneficiary of this shift. A favorable technical signal and an attractive fundamental backdrop present a compelling bullish thesis for SQ Read More
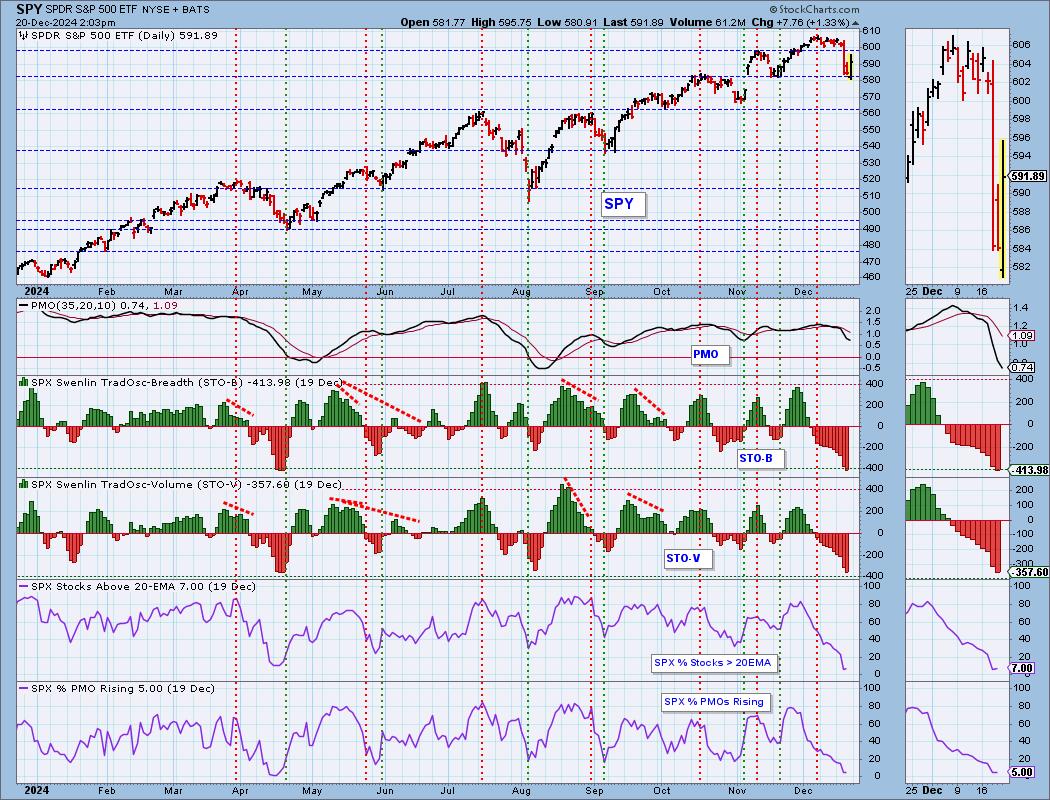
DecisionPoint3mo ago
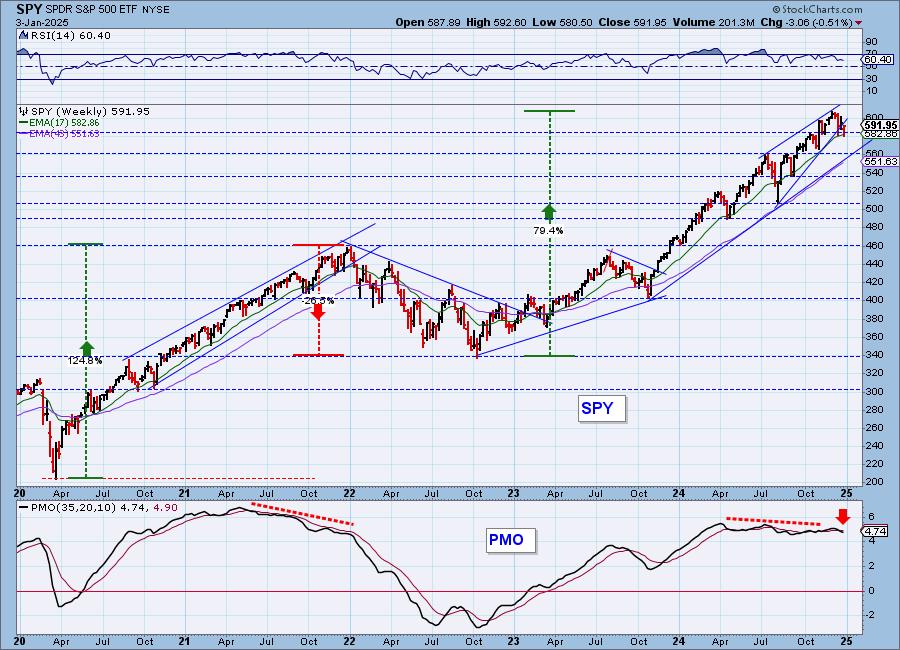
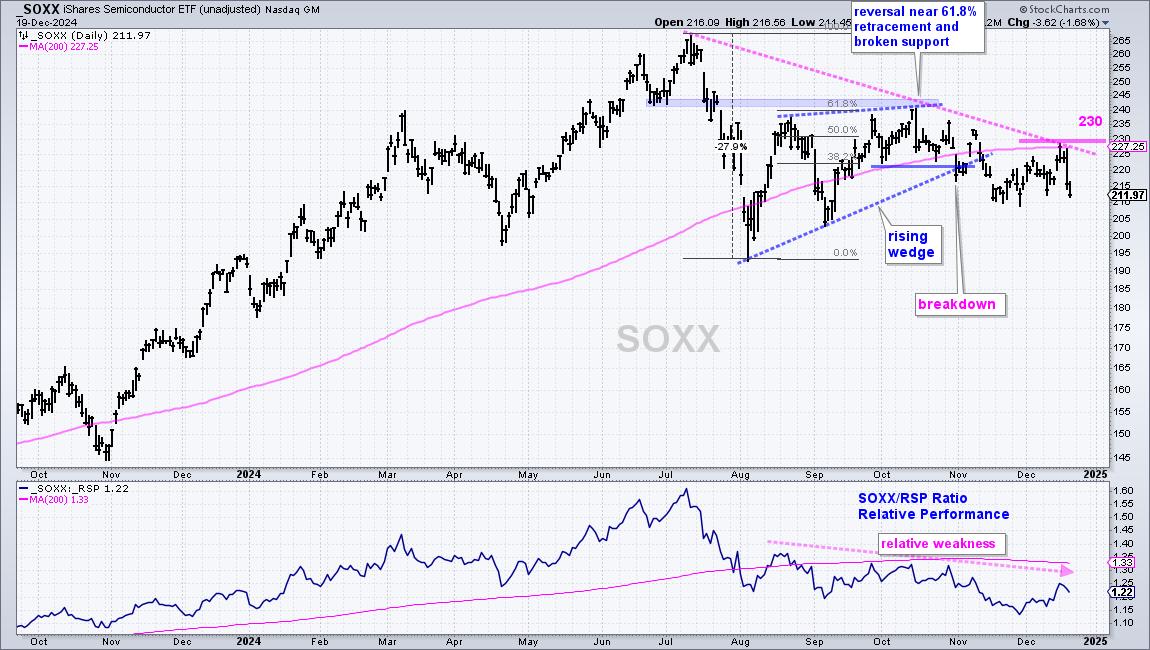
SPY Weekly Chart Breaking Down
We monitor the weekly SPY chart and present it to our subscribers every Friday in our DP Weekly Wrap. We have been watching a bearish rising wedge on the weekly chart. The rising wedge pattern implies that you will get a breakdown from the rising bottoms trendline Read More
RRG Charts3mo ago
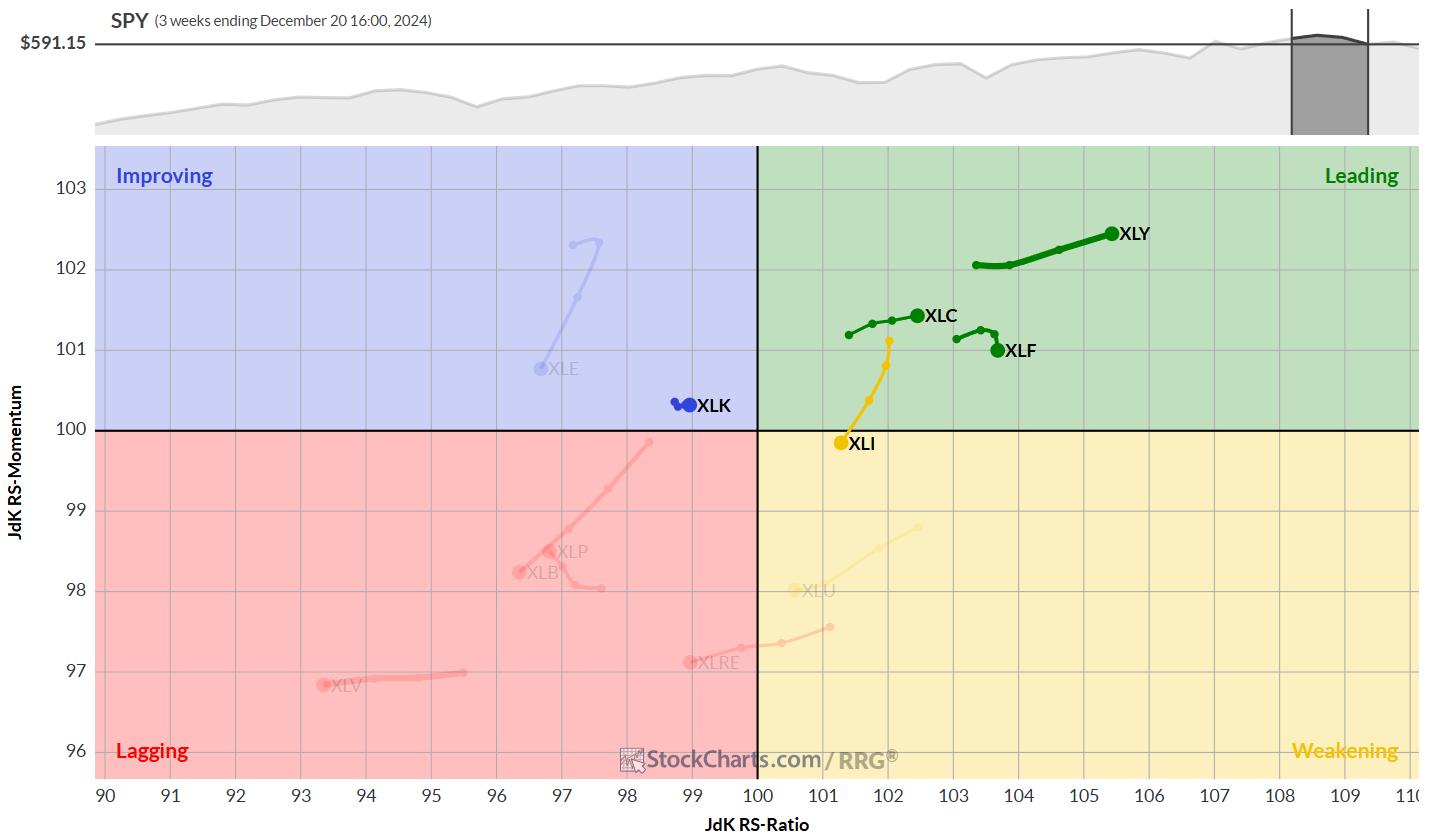
The Best Five Sectors, #1
HAPPY NEW YEAR!!! Ever since the introduction of RRG back in 2011, many people have asked me questions like: "What is the track record for RRG" or "What are the trading rules for RRG"? My answers have always been, and will continue to be, "There is no track record for RRG, as the Read More
Trading Places with Tom Bowley3mo ago
Do You Need Direction for 2025? Here Are 3 Charts You Should NOT Ignore
A little less than a week ago, I wrote an article about inflation and how it's nothing more than a pipe dream in Fed Chief Jay Powell's head. Let me expand on that article, maybe from a slightly different approach this time. The inflation rhetoric just won't let up Read More
Stock Talk with Joe Rabil3mo ago
Is This ADX Pattern a Warning Sign for Investors?
In this exclusive StockCharts video, Joe shares a specific ADX pattern that's signaling potential exhaustion in the momentum right now. Joe analyzes three other market periods that displayed this pattern and the resulting correction which followed Read More
Members Only
Martin Pring's Market Roundup3mo ago
These Bars and Candles May Hold the Key for 2025
Most of the time, when we study bars or candlesticks, our attention is focused on daily and intraday charts, since they give early warnings of a possible change in the short-term trend Read More
ChartWatchers3mo ago

Strongest Top 3 S&P 500 Stocks: Will They Lead the Pack in 2025?
The Santa Claus Rally may be iffy, but a 23.31% gain in the S&P 500 ($SPX) for the year isn't too shabby. It was a stellar year in the stock market, especially for the top 10 weighted stocks in the S&P 500, and that's worth making a toast as we close out 2024 Read More
DecisionPoint3mo ago

DP Trading Room: Natural Gas (UNG) Breaks Out!
It's an interesting market day with the market moving lower despite positive seasonality. Natural Gas (UNG) broke out in a big way up over 15% at the time of writing Read More
Wyckoff Power Charting3mo ago

Swing Trading with Point & Figure
There are a number of effective swing trading systems being used today. Let's explore one that is popular among Wyckoffians. It uses two inputs: Point and Figure charts and volume. Let's review this system with a case study of Charles Schwab Corp. (SCHW) Read More
Trading Places with Tom Bowley3mo ago

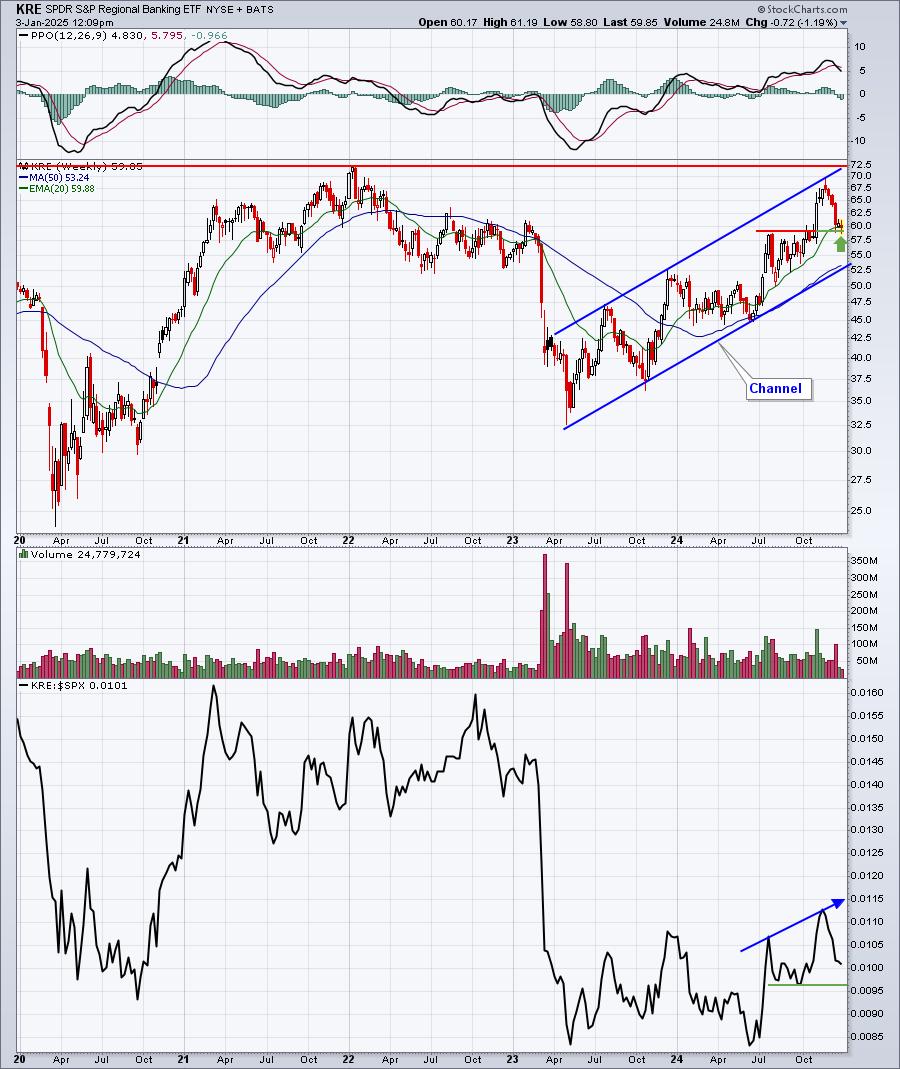
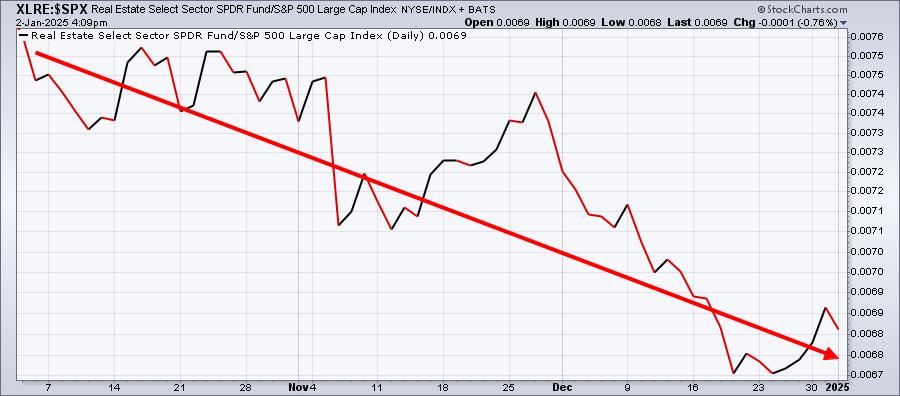
Wall Street Sees No Threat of Inflation
Generally, there are 3 key hedges against inflation - gold ($GOLD), commodities ($XRB), and real estate (XLRE) Read More
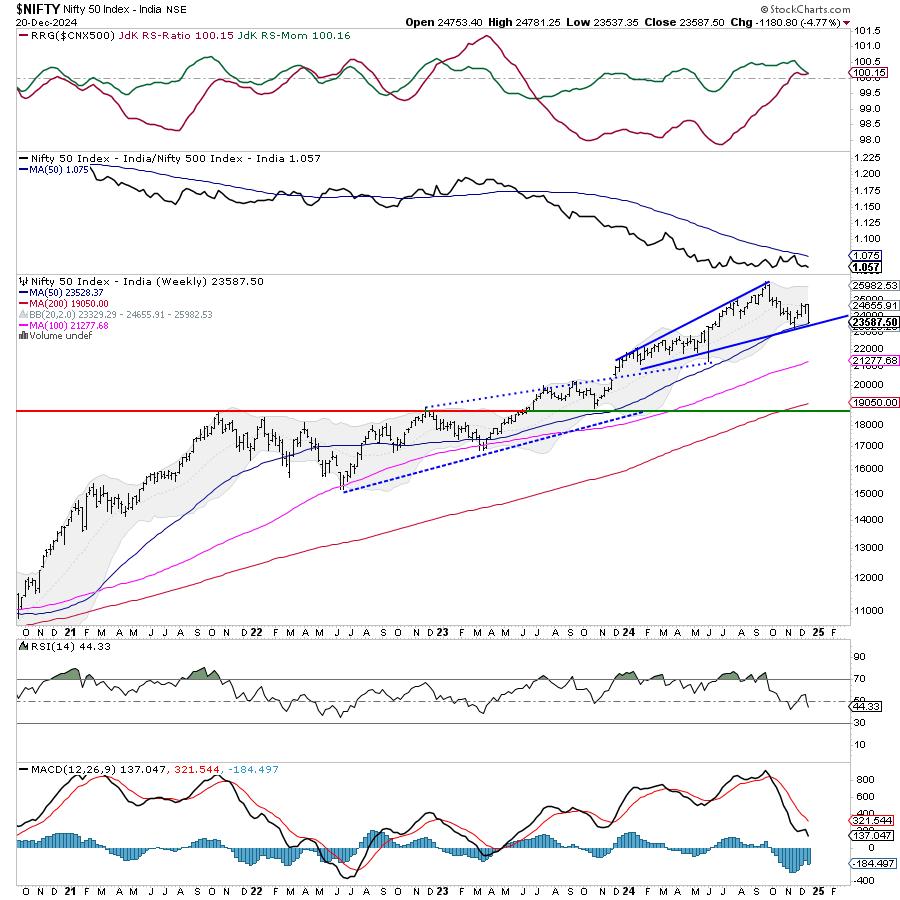
Analyzing India3mo ago

Week Ahead: NIFTY Consolidates, Must Close Above This Level Crucial to Avoid Weakness
After suffering a brutal selloff in the week before this one, the Nifty spent the truncated week struggling to stay afloat just below the key resistance levels. With just four working days, the Nifty resisted each day to the 200-DMA and failed to close above that point Read More
The MEM Edge3mo ago

Trump's Policy Shift Reveals Potential Big Winner!
In this video, Mary Ellen highlights whether to buy last week's pullback. She discusses the rise in interest rates and why, as well as which areas are being most impacted Read More
ChartWatchers3mo ago

5 New Year's Resolutions to Transform Your Financial Well-Being in 2025
Are you ready to make 2025 a financially healthy year? The beginning of a new year is the perfect time to set intentions and make positive changes to your portfolio Read More
Don't Ignore This Chart!3mo ago

Quantum Computing Stocks: Why You Should Invest in Them Now
Qubits, quantum advantage, gate speed — these terms could one day be as ubiquitous as AI or large language model (LLM). Quantum computing could become the next big thing in the technology space and, as an investor, it's something you don't want to ignore Read More
Art's Charts3mo ago

Is this Bounce a Robust Rebound or a Dead-Cat Bounce?
Breadth became oversold last week and stocks rebounded this week. Is this a robust rebound or a dead cat bounce? Today's report will show a key short-term breadth indicator hitting its lowest level in 2024 and becoming oversold Read More
Add-on Subscribers
OptionsPlay with Tony Zhang3mo ago
MUST SEE Options Trade Ideas! DIS, AAPL, META, BA, LULU
In this video, after a rundown of the general markets and sectors, Tony brings you the latest options trade ideas. These include a number of bullish and bearish ideas, including DIS, AAPL, META, BA, LULU, and many more Read More
Don't Ignore This Chart!3mo ago

Why Now Might Be the Best Time to Invest in META Stock
When quickly glancing at the StockCharts Technical Rank (SCTR) Reports Dashboard panel, one stock that popped up on Monday, albiet briefly, was Meta Platforms, Inc. (META) Read More
DecisionPoint3mo ago

DP Trading Room: Deceptive Volume Spikes
In today's free DecisionPoint Trading Room Carl discusses volume spikes and how we have to analyze big volume spikes carefully to determine whether they express a confirmation of a move or whether they are a special case and do not really provide insight Read More
Trading Places with Tom Bowley3mo ago

The Fed Is The New Waffle House
I had no idea the Fed could be such expert wafflers. But, as each month passes, it's becoming clearer. The overall stock market trend, despite all the back-and-forth, yo-yo Fed decisions over the past 6 months, remains to the upside Read More
Analyzing India4mo ago
Week Ahead: NIFTY's Behavior Against This Level To Influence Trends For The Coming Weeks
After staying in the green following a sharp rebound the week before this one, the markets finally succumbed to selling pressure after failing to cross above crucial resistance levels Read More
ChartWatchers4mo ago

Will the Stock Market's Santa Rally Bring Holiday Cheer to Investors?
A smart investor listens to the stock market and this week's stock market action was a perfect example of why this is important Read More
The Mindful Investor4mo ago
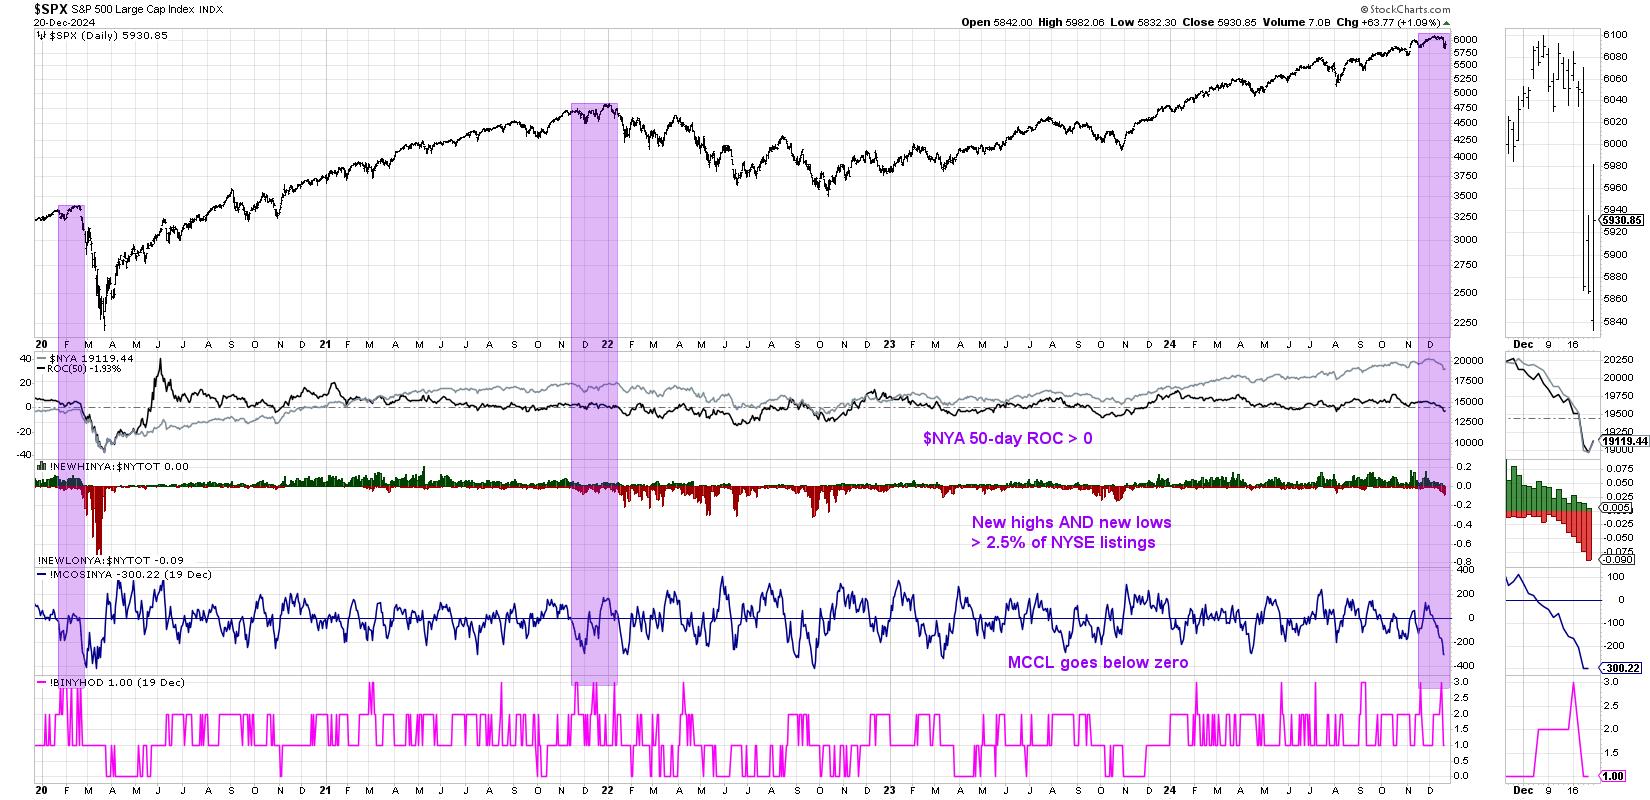
2024's Big Bang: A Deeper Dive Into the Hindenburg Omen
This week saw the fabled Hindenburg Omen generate its first major sell signal in three years, suggesting the endless bull market of 2024 may soon indeed be ending Read More
ChartWatchers4mo ago

AI Boom Meets Tariff Doom: How to Time Semiconductor Stocks
Semiconductors are at a crossroads, with innovation fueling growth and tariffs threatening profits Read More
DecisionPoint4mo ago
Oversold Conditions Not Always a Friend
Nearly all of our charts currently show deeply oversold conditions. While this is usually a good thing, in a market downturn, it isn't necessarily your friend. As you can guess, we believe that Wednesday's big decline was the beginning of something more serious Read More
Members Only
Martin Pring's Market Roundup4mo ago
The Trump Trade? Not All as MAGA as You Might Think
The "Trump Trade" refers to the market reaction and investment strategies that emerged following Donald Trump's election victories and his economic policies Read More
Art's Charts4mo ago
Three Big Negatives Overshadow the Uptrends in SPY and QQQ
SPY and QQQ remain in long-term uptrends, but three big negatives are currently hanging over the stock market. Two negatives are tied to important cyclical groups and the third is reminiscent of summer 2022 Read More
Don't Ignore This Chart!4mo ago

Navigating the Indecisive SPY: What Investors Should Know
When running my StockCharts Technical Rank (SCTR) scan on Thursday, I was a little surprised to find that 75 exchange-traded funds (ETFs) and large-cap stocks made the cut, especially after Wednesday's selloff. It was a little ray of hope Read More
RRG Charts4mo ago
Three RRGs to Keep You on Track
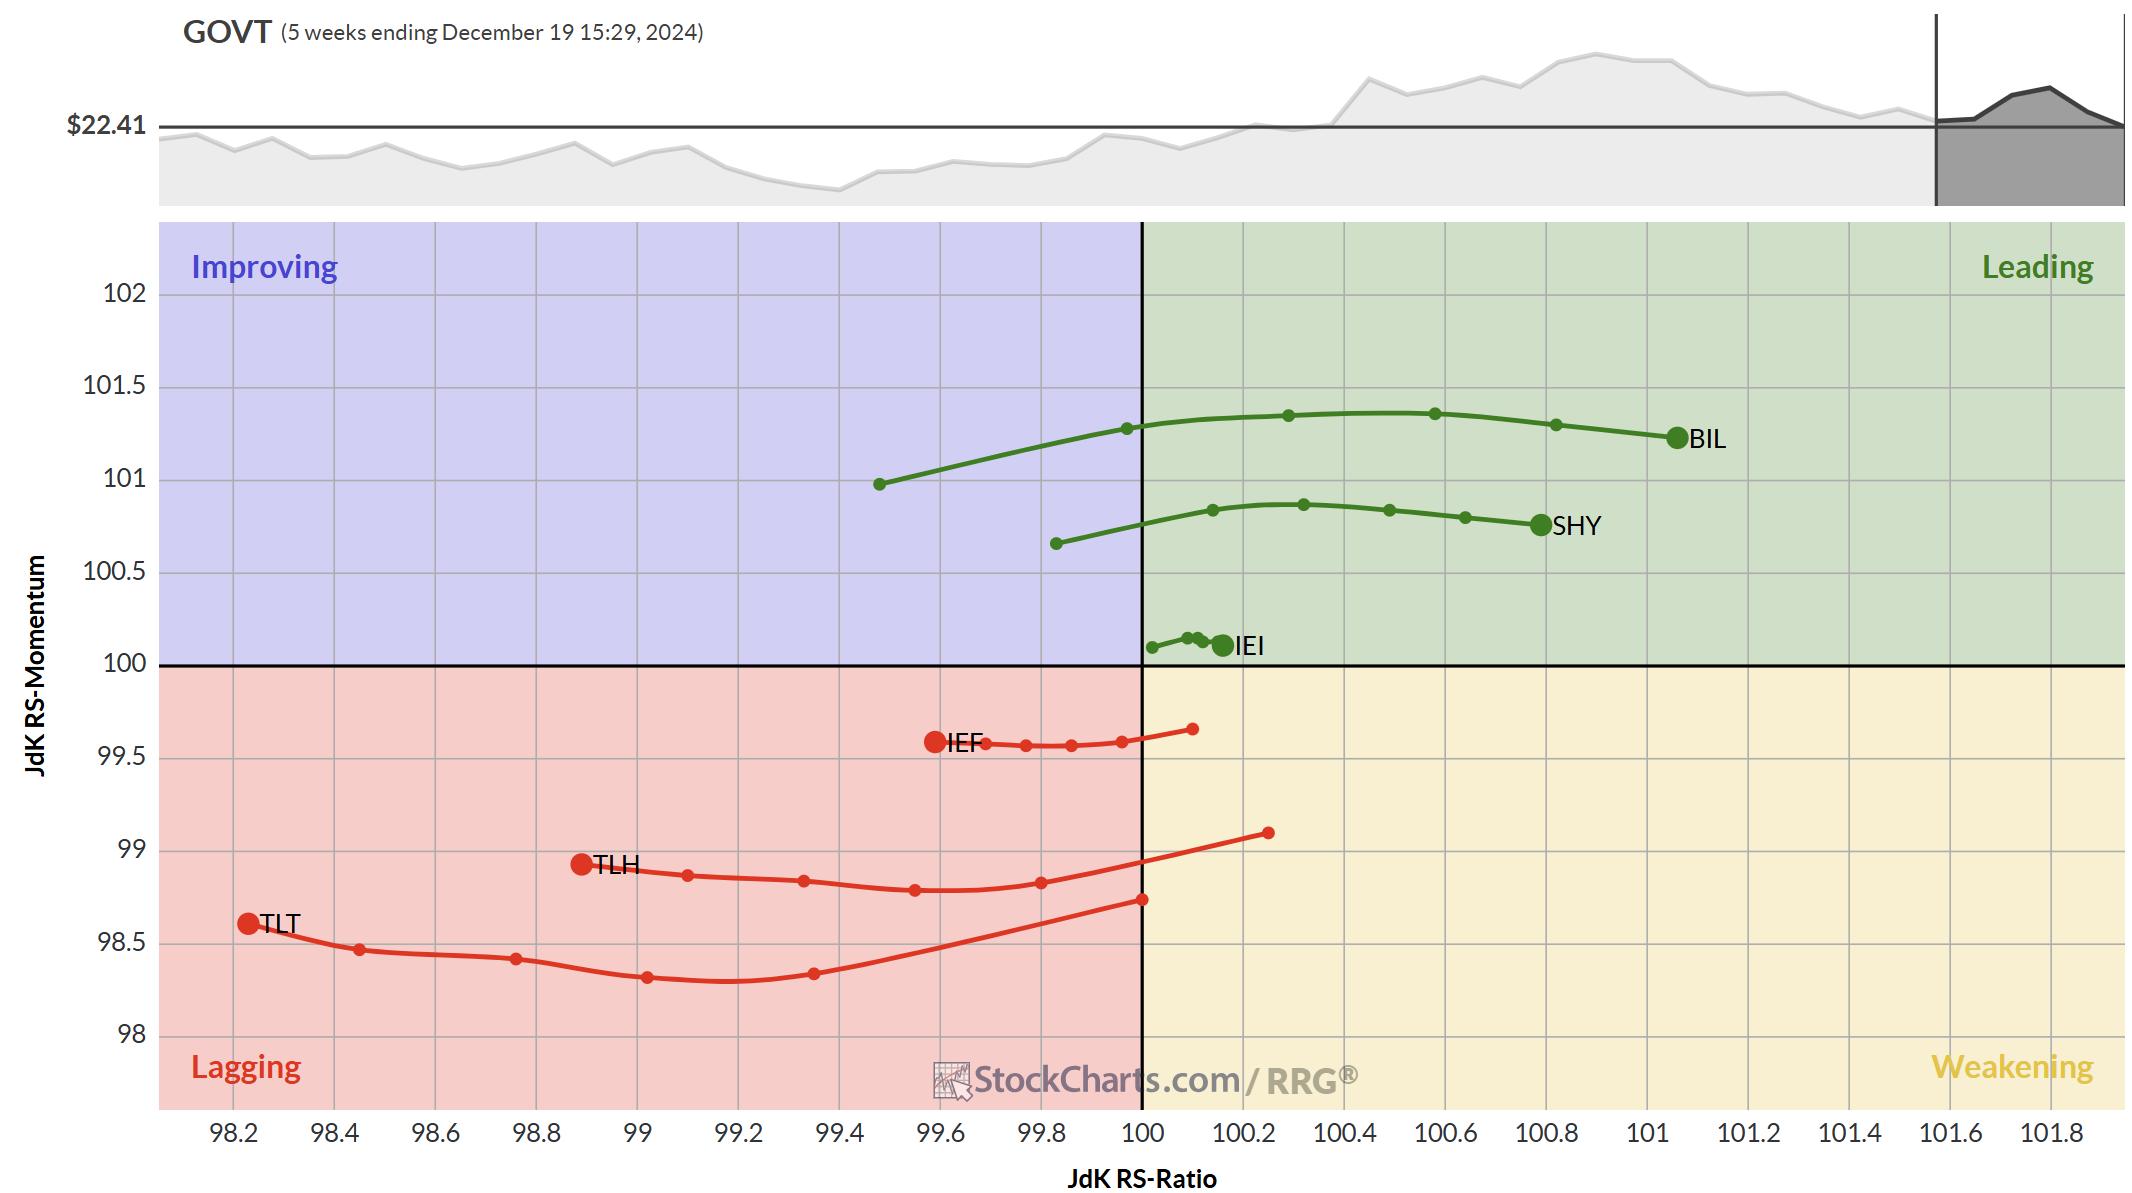
The Yield Curve The RRG above shows the rotations of the various maturities on the US-Yield Curve Read More
ChartWatchers4mo ago

Stock Market Sell-Off: Is the Bull Market Over?
Uncertainty in the stock market makes it difficult to make investment decisions. When investors sell off stocks, everyone follows without giving it much thought and you're left trying to figure out which path you should take Read More
The Mindful Investor4mo ago

The Big Divergence in Bullish Percents
While the S&P 500 and Nasdaq 100 have been holding steady into this week's Fed meeting, warning signs under the hood have suggested one of two things is likely to happen going into Q1 Read More
Popular Articles

This is the Group to Watch for the Next Bull Market Phase and Separating Noise from Reality

The Bottom is Here or Rapidly Approaching

An Oversold Bounce is One Thing - A Bullish Breadth Thrust is Another

When in Doubt, Follow the Leadership

Bullish Percent Index Confirms Short-Term Rebound

200-Day Moving Average Confirms Bearish Phase
Get expert technical commentary delivered straight to your inbox! Sign up for our FREE weekly ChartWatchers Newsletter. Learn More
Featured Authors


Public ChartList Leaders


StockCharts Members unlock complete access to the Stocks & Commodities Magazine archives. Read the latest articles or browse past editions.