Art's Charts March 28, 2025 at 05:45 AM
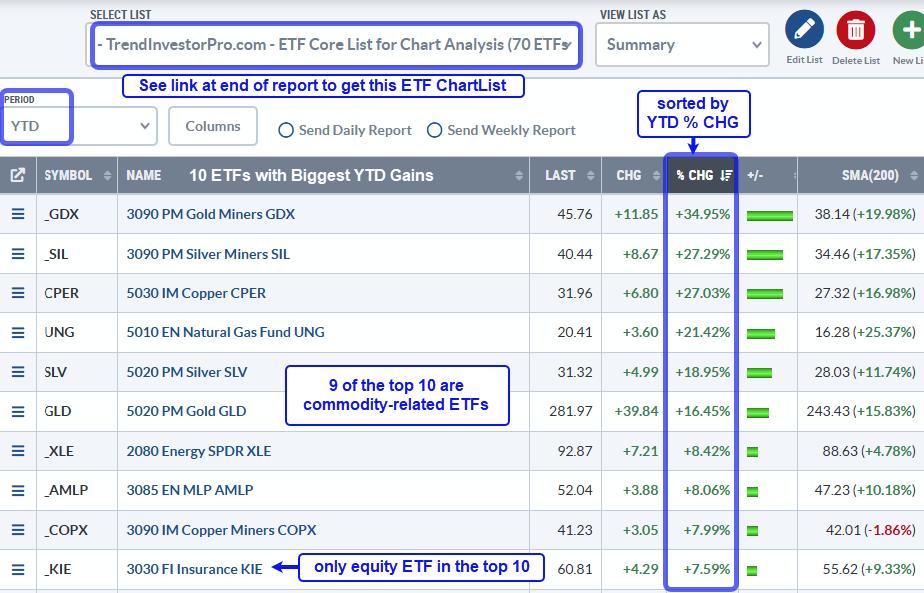
The performance profile for 2025 says a lot about the state of the market. Commodity-related ETFs are leading, non-cyclical equity ETFs are holding up the best and cyclical names are performing the worst. Clearly, this is not a positive picture for the stock market... Read More
Art's Charts March 21, 2025 at 01:13 PM
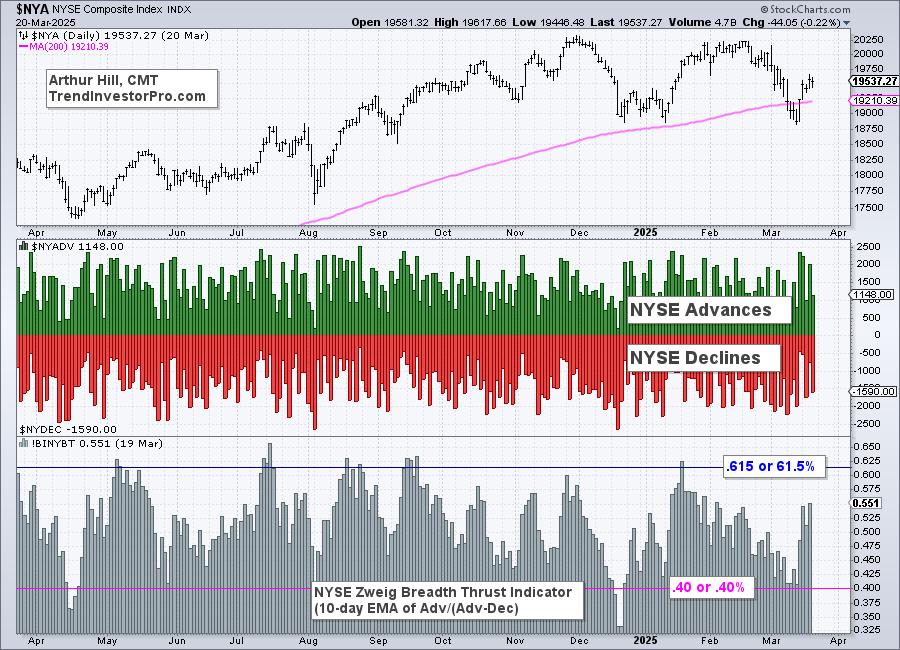
The Zweig Breadth Thrust is best known for its bullish reversal signals, which capture a material increase in upside participation. There is, however, more to the indicator because traders can also use the "setup" period to identify oversold conditions... Read More
Art's Charts March 14, 2025 at 03:14 PM

The weight of the evidence shifted to the bears over the last few weeks. First, the major index ETFs reversed their long-term uptrends with Bollinger Band signals, our breadth models turned net negative and yield spreads widened... Read More
Art's Charts March 07, 2025 at 05:53 PM
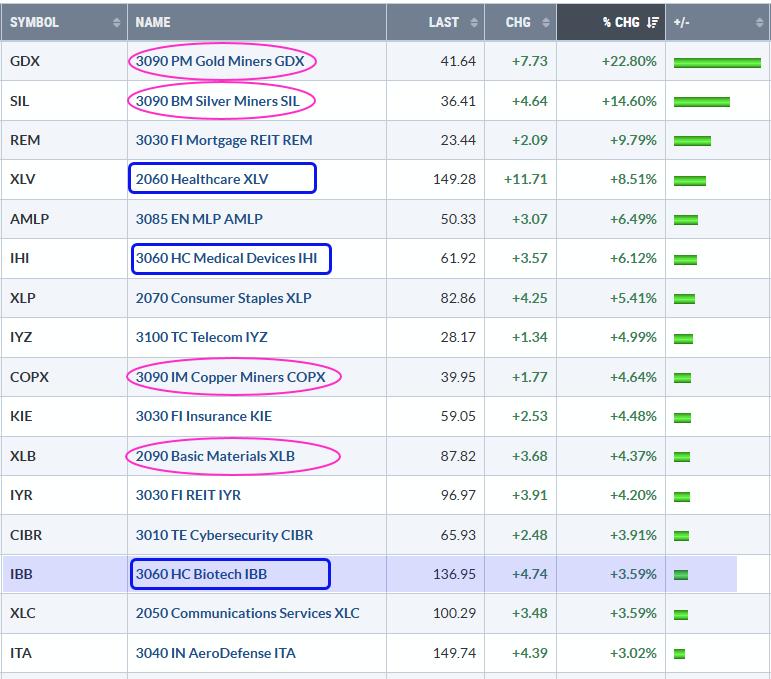
2025 is off to a rough start for stocks, but there are still some pockets of strength in the market. Year-to-date, SPY is down 1.73%, QQQ is down around 4% and the S&P SmallCap 600 SPDR (IJR) is down over 6%... Read More