Art's Charts March 30, 2024 at 09:39 AM

Momentum and trend strategies are off to a roaring start here in 2024. More often than not, these strategies buy leading stocks that appear overbought... Read More
Art's Charts March 23, 2024 at 07:42 AM

The 200-day SMA is perhaps the most widely used long-term moving average. As its name implies, it is a simple indicator that chartists can use for trend-following and momentum strategies. For trend-following, we just need to know where prices stand relative to the 200-day SMA... Read More
Art's Charts March 17, 2024 at 04:58 PM

The 20+ Yr Treasury Bond ETF (TLT) failed again at the falling 40-week SMA and looks poised to resume its bigger downtrend. Keep in mind that bonds and yields move in the opposite direction... Read More
Art's Charts March 15, 2024 at 10:43 AM

The Oil & Gas Equipment & Services ETF (XES) is showing strength here in March as it breaks back above its 40-week SMA. More importantly, the long-term trend is up and this week's breakout argues for a continuation of this uptrend... Read More
Art's Charts March 08, 2024 at 03:46 AM

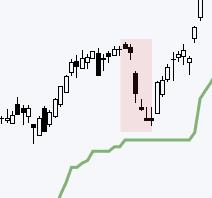
As its name suggests, the ATR Trailing Stop is normally used to trail a stop-loss for a long position. It can also be used to identify an outsized decline that could reverse an uptrend... Read More
Art's Charts March 01, 2024 at 12:18 PM

Most stocks surged with the broader market in the fourth quarter of 2023. SPY and QQQ extended their advances in 2024, but some stocks did not partake and fell back. Even so, some of these stocks show signs of long-term trend reversals and their declines in 2024 look corrective... Read More