 Chartists looking for momentum leaders should consider more than one timeframe. A stock may be leading over the last 200 days, but lagging over the last 100 days. Similarly, a stock could show big gains the last 100 days, but still be down over the last 200 days. Measuring performance over different timeframes allows us to identify stocks that are consistently strong.
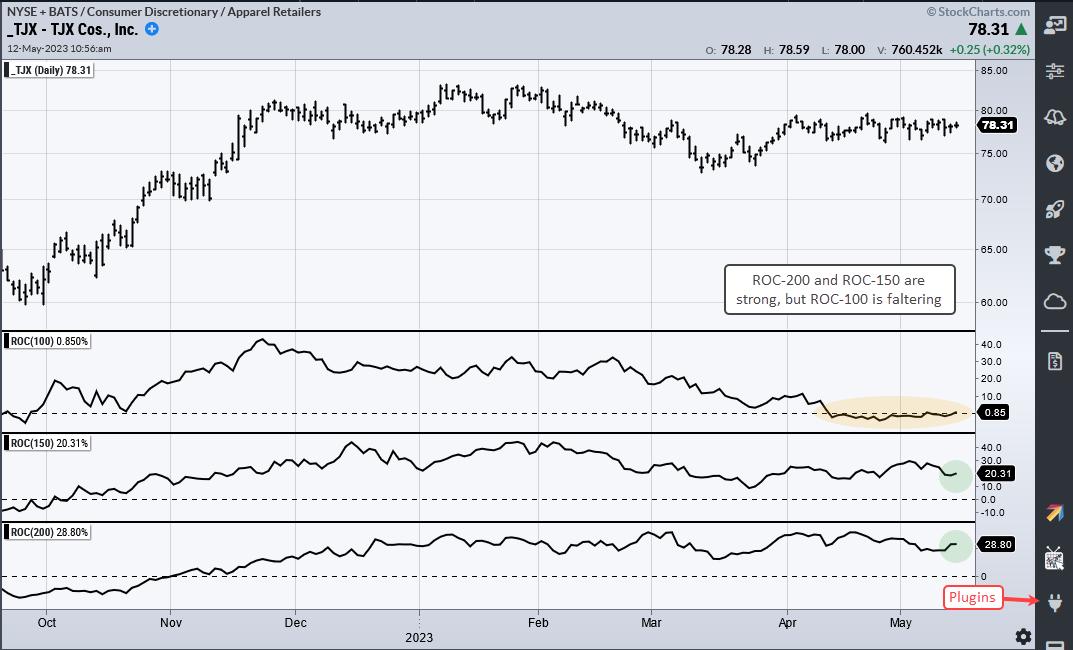
The first chart shows TJX Cos (TJX) with the Rate-of-Change (ROC) indicator covering 100, 150 and 200 days. Hench, the three ROCs. Rate-of-Change is simply the percentage change over the given timeframe. TJX is up around 29% over the last 200 days (bottom window) and up around 20% over the last 150 days. However, it is flat over the last 100 days and is faltering on this time frame (yellow shading). TJX is not a consistent and persistent leader because it is dragging its feet on the 100-day timeframe.

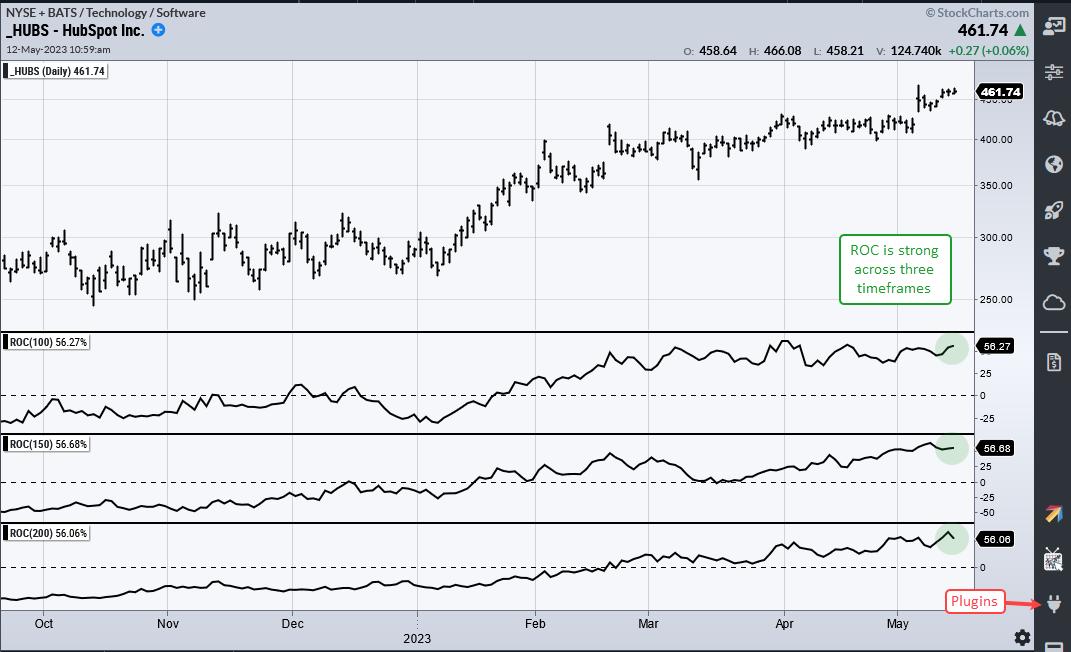
The next chart shows HubSpot (HUBS) and the three ROCs tell a different story. All three are above 50% and showing strength over all three timeframes. HUBS is a consistent and persistent leader right now. This is a name we went on our watch list for tradable pullbacks or in a portfolio of momentum leaders.

TrendInvestorPro develops and maintains quantified trading strategies for stocks and ETFs. We currently have three active ETF strategies and a stock strategy in the beta stage. This stock strategy uses an Average Rate-of-Change indicator to rank stocks and select momentum leaders. Click here to learn more.
The Trend Composite, ATR Trailing Stop and nine other indicators are part of the TrendInvestorPro Indicator Edge Plugin for StockCharts ACP. Click here to take your analysis process to the next level.
---------------------------------------
Choose a Strategy, Develop a Plan and Follow a Process
Arthur Hill, CMT
Chief Technical Strategist, TrendInvestorPro.com
Author, Define the Trend and Trade the Trend
Want to stay up to date with Arthur's latest market insights?
– Follow @ArthurHill on Twitter
