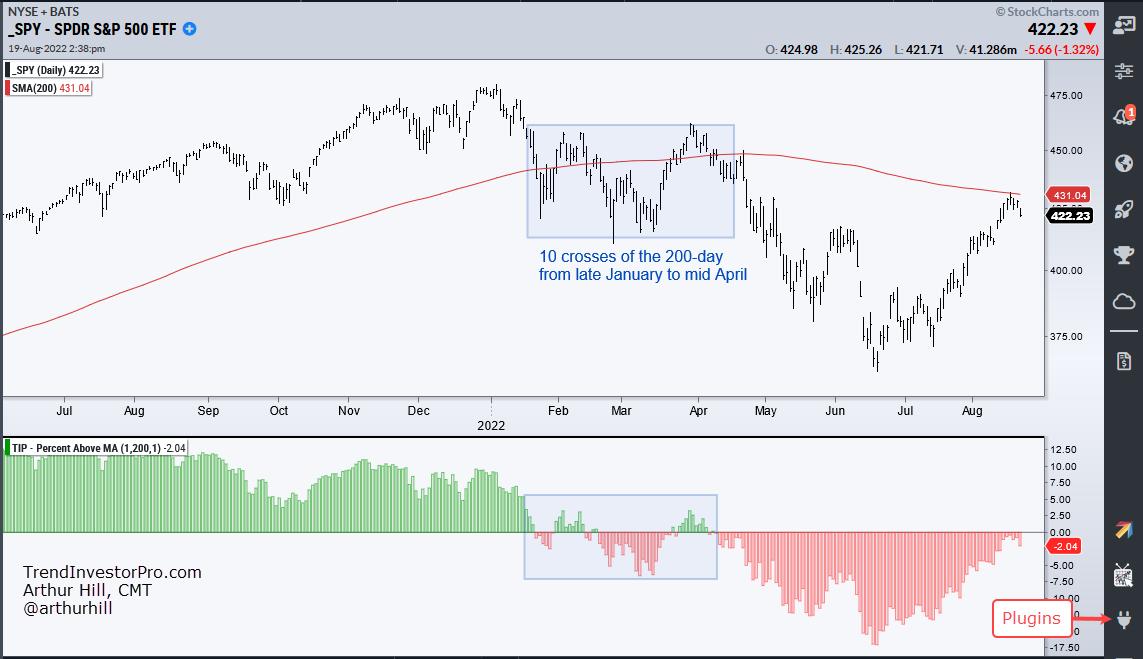
 The S&P 500 SPDR (SPY) surged to its falling 200-day SMA here in August and even edged above this key level intraday on Tuesday. Even though the ETF is close to crossing above the 200-day, chartists would be better off taking a step back to avoid a whipsaw. Note that SPY has crossed the 200-day SMA over 150 times since 2000. This may not seem like many for a 22 year period, but these crosses tend to cluster because the 200-day SMA is a real battle zone.

The chart above shows SPY with the 200-day SMA and Percent Above MA (1,200,1) in the indicator window. First, notice that SPY crossed the 200-day SMA ten times from late January to mid April (blue shading). Talk about whipsawing. The indicator in the lower window visualizes these crosses by turning positive (green) when the 1-day SMA (close) crosses above the 200-day SMA and red when below.
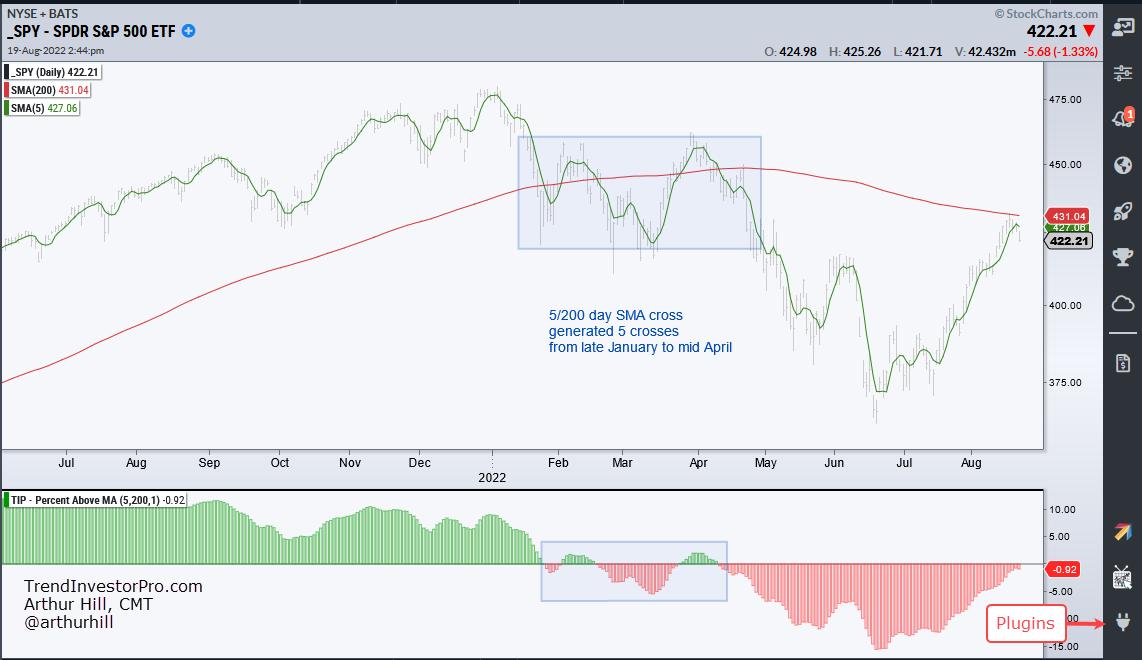
Chartists can reduce whipsaws and improve performance by smoothing closing prices with a short moving average. This could be 5, 20 or even 50 days. The 50/200 cross, also known as the golden cross, is perhaps the most popular combination. I prefer a 5-day SMA because the 20 and 50 day SMAs lag too much and generate bigger drawdowns (think March 2020). The next chart shows the 5-day crossing the 200-day just five times from late January to mid April. The indicator window shows Percent Above MA (5, 200, 1) confirming these crosses. This indicator is part of the TrendInvestorPro Indicator Edge Plugin for StockCharts ACP.

Now let's quantify performance with a backtest. Since 2000, buying and selling the close/200-day SMA cross generated 83 trades with an annual return of 4.53%, a win rate of 34% and a maximum drawdown of 14.7%. There are two crosses for every trade and dividends were not included. Buying and selling the 5/200 day SMA cross generated just 31 trades with an annual return of 5.6%, a win rate of 42% and a Maximum Drawdown of 20%. The higher annual return and better win rate make the 5/200 cross a more robust strategy. Also note that SPY remains in a long-term downtrend because it is below the falling 200-day and the 5-day is below the 200-day. It's elementary my dear Watson.
This week at TrendInvestorPro, the Composite Breadth Model hit a make of break level and two inputs turned bullish the last two weeks, but three remain bearish. Our recent focus has been on seasonality, oil, energy ETFs and agriculture ETFs. Click here for immediate access to our reports and weekly video.
The StochClose, the Trend Composite, ATR Trailing Stop and eight other indicators are part of the TIP Indicator Edge Plugin for StockCharts ACP. Click here to take your analysis process to the next level.
---------------------------------------
Choose a Strategy, Develop a Plan and Follow a Process
Arthur Hill, CMT
Chief Technical Strategist, TrendInvestorPro.com
Author, Define the Trend and Trade the Trend
Want to stay up to date with Arthur's latest market insights?
– Follow @ArthurHill on Twitter
