 The broad market environment is the single most important factor to consider when investing in stocks or stock-related ETFs. Are we in a bull market or a bear market? The recent expansion of new lows and the 5/200 cross in the S&P 500 suggest that we are in a bear market environment.
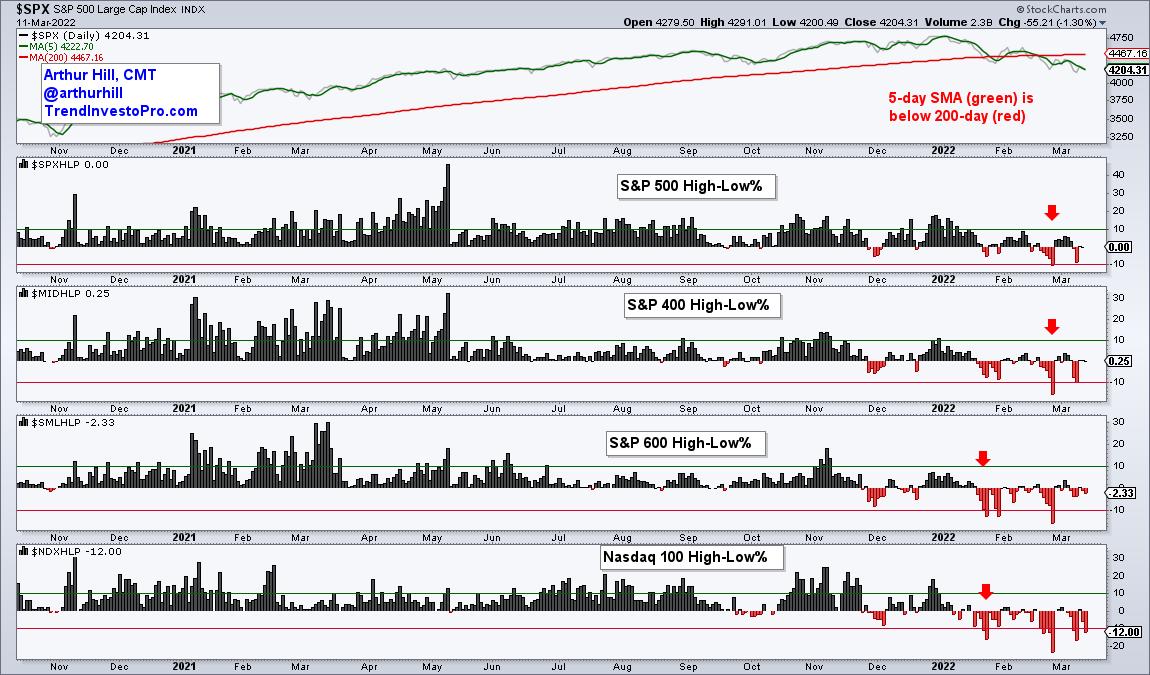
The chart below shows the S&P 500 in the top window and the High-Low Percent indicators for four major indexes in the lower windows (S&P 500, S&P MidCap 400, S&P SmallCap 600 and Nasdaq 100). First and foremost, the S&P 500 is in a downtrend because the 5-day SMA (green) is around 5.5% below the 200-day SMA (red). The S&P 500 is the most important benchmark for US stocks and a downtrend bodes ill for most stocks.

The High-Low Percent indicators were strong until November 2021, took a hit in December and turned bearish here in 2022. The red arrows show S&P 500 High-Low% and S&P MidCap 400 High-Low% dipping below -10% in late February. Prior to that, S&P SmallCap 600 High-Low% and Nasdaq 100 High-Low% dipped below -10% in late January. These moves below -10% broke my bearish threshold and show an expansion of new lows throughout the market. This is bearish for the broader market.
High-Low Percent equals the percentage of stocks hitting new 52-week highs in an index less the percentage hitting new 52-week lows. A stock is in a strong downtrend and leading lower when hitting a 52-week low. The more stocks in strong downtrends, the more bearish for the market. The green lines are at +10% and the red lines are at -10%.
Interested in breadth indicators? StockCharts members who subscribe to TrendInvestorPro are entitled to the essential breadth indicator chartlist. This list has over 100 customized charts with dozens of indicators. It is also organized in a logical top-down manner. Click here to subscribe and get immediate access.
This week's Next Level Charting video (here) covered the bullish setup in the 10-yr Treasury Yield (bearish for bonds), the breakouts in the Silver and Defense ETFs, and the long-term bullish setups in some clean energy ETFs.
The TIP Indicator Edge Plugin for StockCharts ACP has 11 indicators designed to help with your analysis and trading process. These include the Trend Composite, the Momentum Composite and ATR Trailing. Click here to learn more.
---------------------------------------------------
Choose a Strategy, Develop a Plan and Follow a Process
Arthur Hill, CMT
Chief Technical Strategist, TrendInvestorPro.com
Author, Define the Trend and Trade the Trend
Want to stay up to date with Arthur's latest market insights?
– Follow @ArthurHill on Twitter
