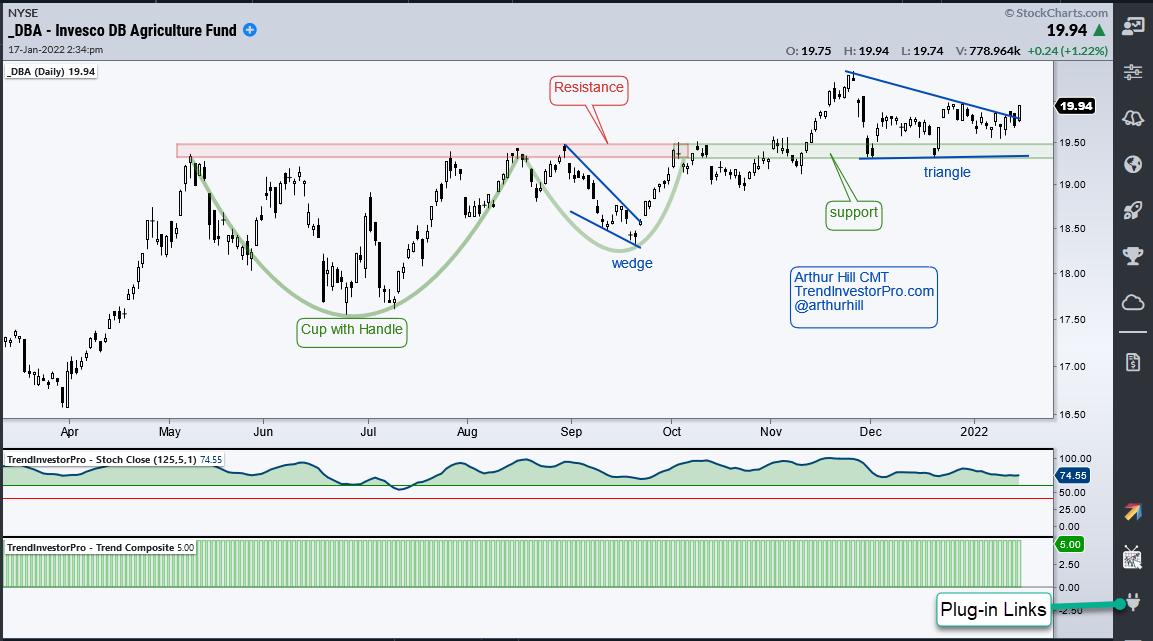
 The DB Agriculture ETF (DBA) was featured in ChartWatchers on October 1st as it formed a large cup-with-handle pattern, which is a bullish continuation pattern. The ETF battled its resistance zone the rest of the month and broke out to new highs in November. Flash forward to January and we have a short-term bullish consolidation and breakout working.
The chart below shows DBA with the cup-with-handle breakout and broken resistance turning into support after the breakout (red/green shading). Notice how DBA fell sharply in early December and the broken resistance zone held as buyers stepped back in (support). "Broken resistance turns support" is a classic tenet of technical analysis that traders can use to catch post-breakout throwbacks (return to resistance).

The DB Agriculture ETF extended its consolidation into January with prices holding above the resistance breakout. This is also a sign of strength because the breakout is holding. A triangle of sorts formed (blue lines) and DBA broke out with a bounce the last four trading days. This consolidation digested the gains from mid-September to late November and represents a bullish continuation pattern, or rest within the uptrend. The breakout signals a continuation higher and new highs are expected.
TrendInvestorPro specializes in finding bullish setups within bigger uptrends in our core list of 129 ETFs. We also have a Composite Breadth Model for broad market timing as well as an ETF Ranking and Trend Signal Table. Click here to take your charting to the next level.
Note that StochClose (125,5) and the Trend Composite are two trend-following indicators available on the TIP Indicator Edge Plugin for StockChartsACP (here).
---------------------------------------------------
Choose a Strategy, Develop a Plan and Follow a Process
Arthur Hill, CMT
Chief Technical Strategist, TrendInvestorPro.com
Author, Define the Trend and Trade the Trend
Want to stay up to date with Arthur's latest market insights?
– Follow @ArthurHill on Twitter
