 When it comes to analysis and trading signals, seasonality is behind price action in the pecking order of importance. In general, seasonal patterns carry most weight when they jibe with the underlying trend. For example, bullish seasonal patterns in an uptrend can provide a tailwind. Nevertheless, price action is still the single most important barometer and I would not let a seasonal pattern override a price-based signal.
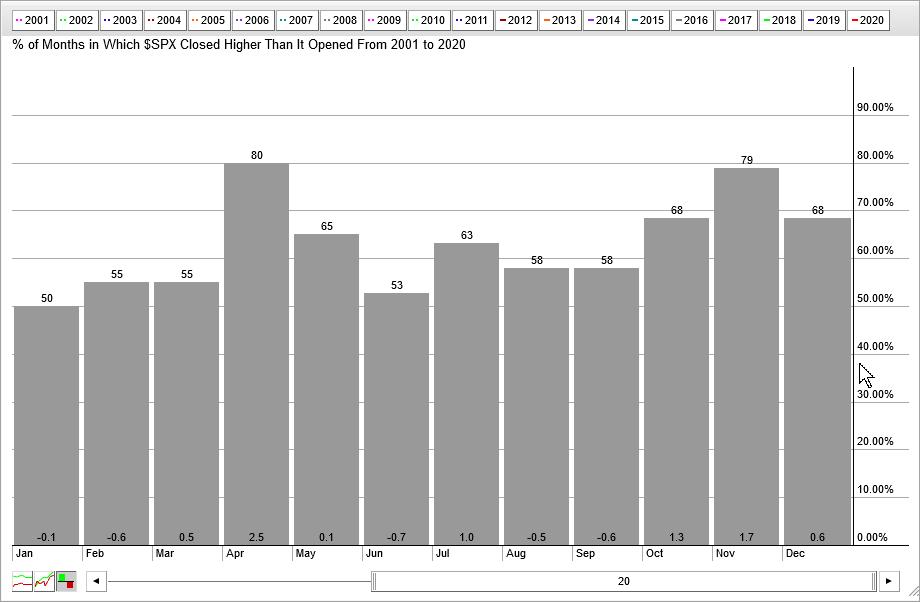
The image below shows the monthly seasonal patterns for the S&P 500 over the last 20 years with two months standing out: April and November. April closed higher 80% of the time and November closed higher 79 percent of the time. The average gain for April was 2.5%, which was seriously helped with this year's historic 12.68% gain.

We are currently entering May, and June is around the corner. May closed higher 65% of the time and the average gain was just .10%, which was influenced by a 6.58% decline last year. June closed higher just 53% of the time and the average gain was a loss (-.70%), which was influenced by a 6.89% gain last year. Yes, you read right. The S&P 500 fell 6.58% last May and then rose 6.89% the very next month. Welcome to the rodeo.
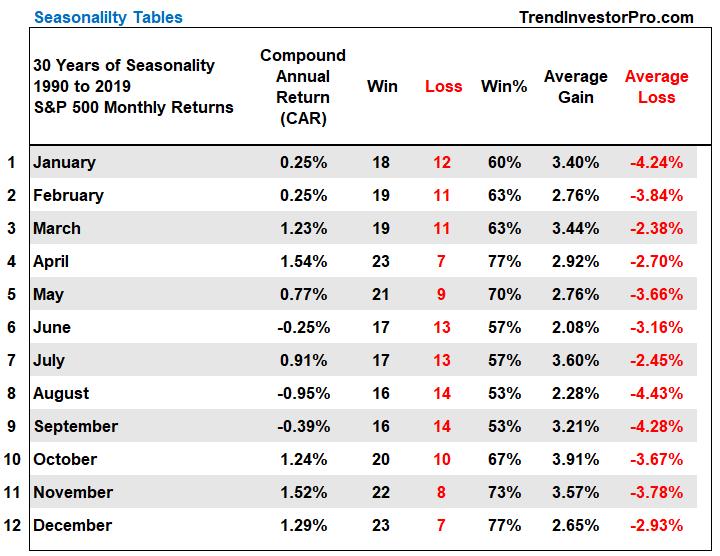
We can take this seasonal study one step further by looking at the Compound Annual Return (CAR) and Equity Curve for a strategy that was long just one particular month for the last 30 years. These tests run from January 1990 to December 2019 (30 complete years). The results do not include 2020. The Compound Annual Return shows if a strategy that owned the S&P 500 in only that particular month made money and the equity curves reflect the path this strategy took over the 30 year period.
Let's review some static numbers to start. The table below shows that May closed higher 70% of the time over the last 30 years and June closed higher 57% of the time. The Compound Annual Return was +.77% in May and -.25% for June. May is still looking slightly positive, but June is looking quite shaky.

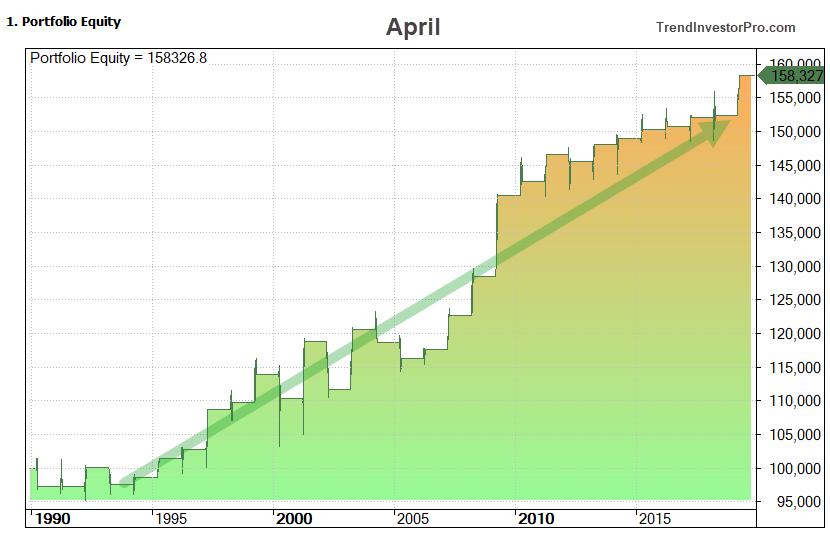
Now let's look at the equity curves for each month. By the way, I am starting with the equity curve for April, which is truly a thing to behold. It goes from the lower left to the upper right as the portfolio grew on a consistent basis. This shows that April has been a consistent gainer over the last 30 years. Keep in mind that this does not include 2020.

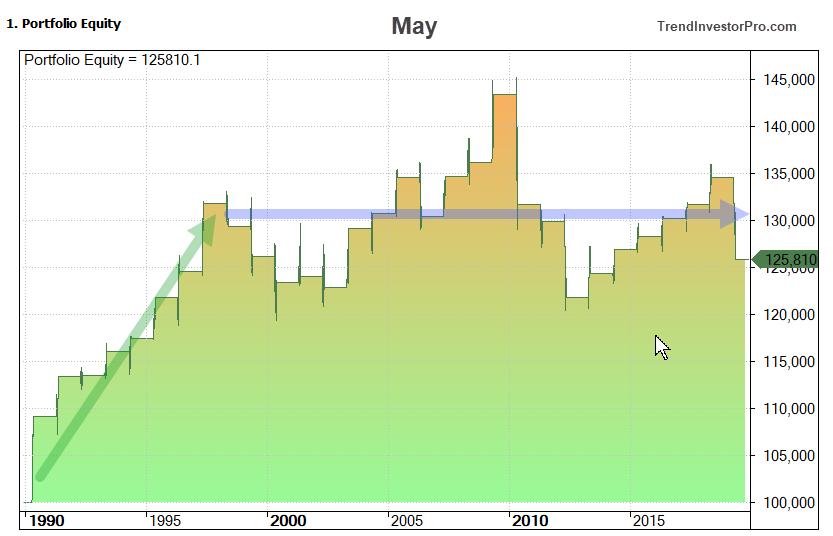
The next image shows the equity curve for May. The portfolio grew the first eight years, but zigzagged the last 22 years. Notice that current equity is below the 1997 peak. Thus, May looks like a coin flip at best.

The short-term trend (7-8 weeks) is currently up for the S&P 500, but the index is still below the 200-day SMA. Even though this could be a bear market bounce, the short-term uptrend rules until it reverses. Seasonal patterns are neutral in May, but they are bearish in June. Keep these in mind going forward.
Want to see the equity curves for all 12 months? Subscribe to TrendInvestorPro.com for the complete report on monthly seasonality. We identify five months with consistently rising equity curves and two months with the weakest equity curves.
Click here to take your analysis to the next level!
---------------------------
Choose a Strategy, Develop a Plan and Follow a Process
Arthur Hill, CMT
Chief Technical Strategist, TrendInvestorPro.com
Author, Define the Trend and Trade the Trend
Want to stay up to date with Arthur's latest market insights?
– Follow @ArthurHill on Twitter
