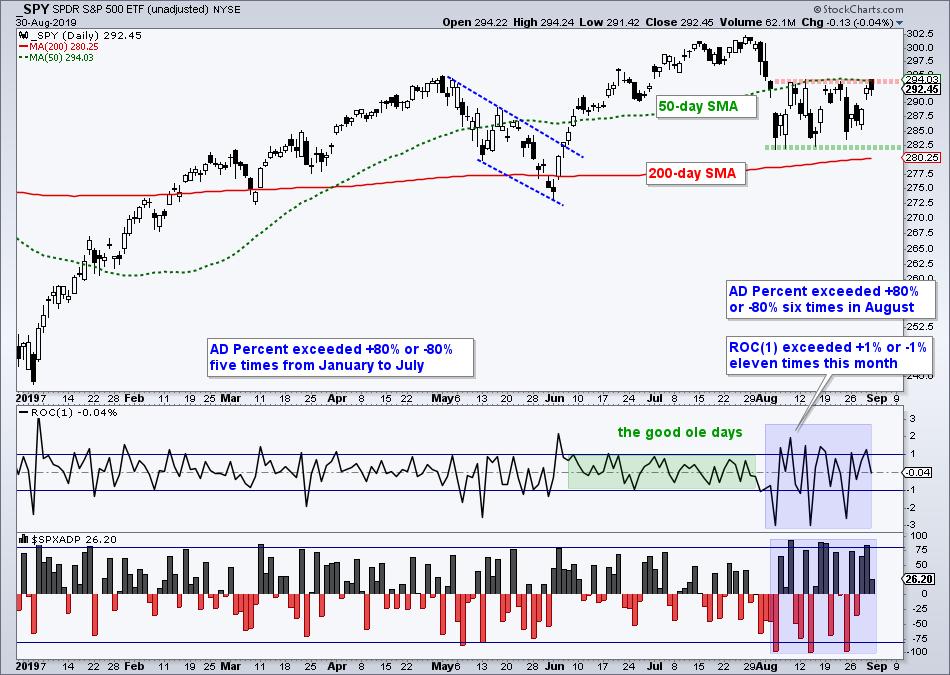
Stocks opened strong on Friday morning and then sold off ahead of a three day weekend. Well, the weekend has passed and stocks are set to open lower on Tuesday. What a surprise! August was volatile for the S&P 500. And yet it was also not volatile. The 1-day Rate-of-Change exceeded +-1% eleven times, but the index went nowhere and remained range bound. There were six one-day breadth thrusts as S&P 500 AD Percent ($SPXADP) exceeded +-80% six times, but these are split with 3 bearish breadth thrusts and 3 bullish breadth thrust. August was a push.

Despite some big 1-2 day moves with strong breadth, the index did not follow through, to the upside or the downside. Each pop was met with a drop and each drop was answered with a pop. Sell at resistance and buy at support worked well for short-term traders. One day we will get a clean break and this break will provide the next directional clue.
------------------------------------------------------------
Bottom Line
As noted in the State of the Stock Market on Friday, the market is quite mixed. The S&P 500 is still net bullish, but the S&P Mid-Cap 400 and S&P Small-Cap 600 are net bearish. Overall, I am more bearish than bullish, simply because my Index Breadth Model is net bearish. Who am I to question THE model!

I am quite focused on the broader market environment right now because the Index Breadth Model turned bearish in mid August. Even though there are still plenty of strong uptrends in individual stocks (ABT, AKAM, CYBR, DIS, MA, MSFT, PG, TMO), the broad market environment is still the biggest factor to consider. Correlations tend to rise in bear market environments and this makes it harder to pick winners. Just look at ULTA.
------------------------------------------------------------
SPY and QQQ Hold Up, but IWM Sinks
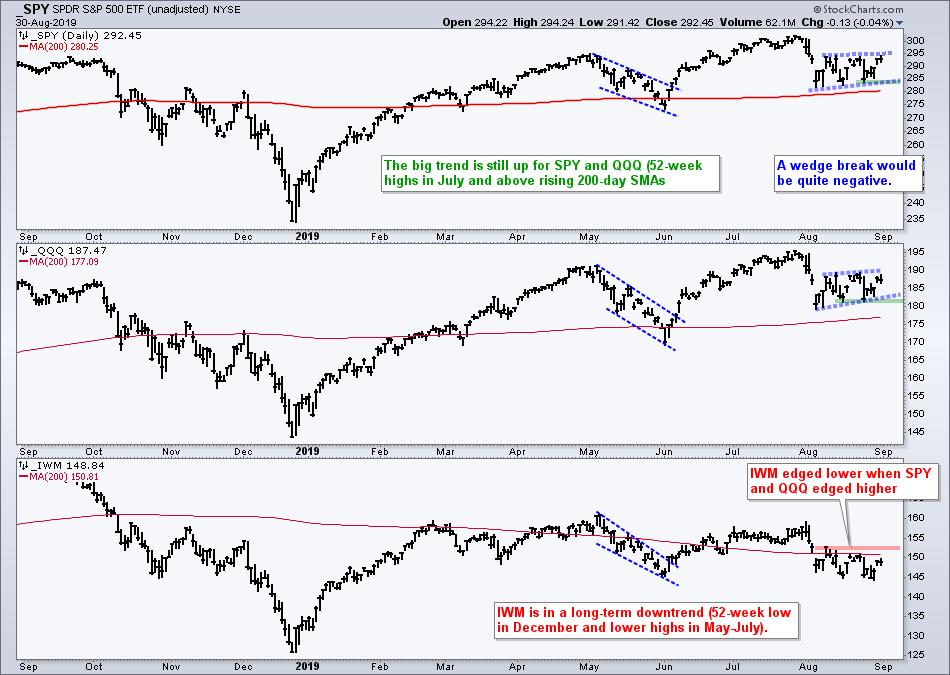
A bearish bias means the odds favor downside follow through and a downside break. The next chart shows SPY and QQQ with rising wedges in August. IWM, which is in the bottom window, edged lower when SPY and QQQ edged higher. Small-caps continue to underwhelm.

The late August lows mark support for QQQ and SPY. Breaks here would signal a continuation of the early August decline and target a test of the early June low. The bulls have hope as long as the late August lows hold. For IWM, I am watching the early August high for a breakout that could be quite positive for the market.
------------------------------------------------------------
XLY and XLK Carry August
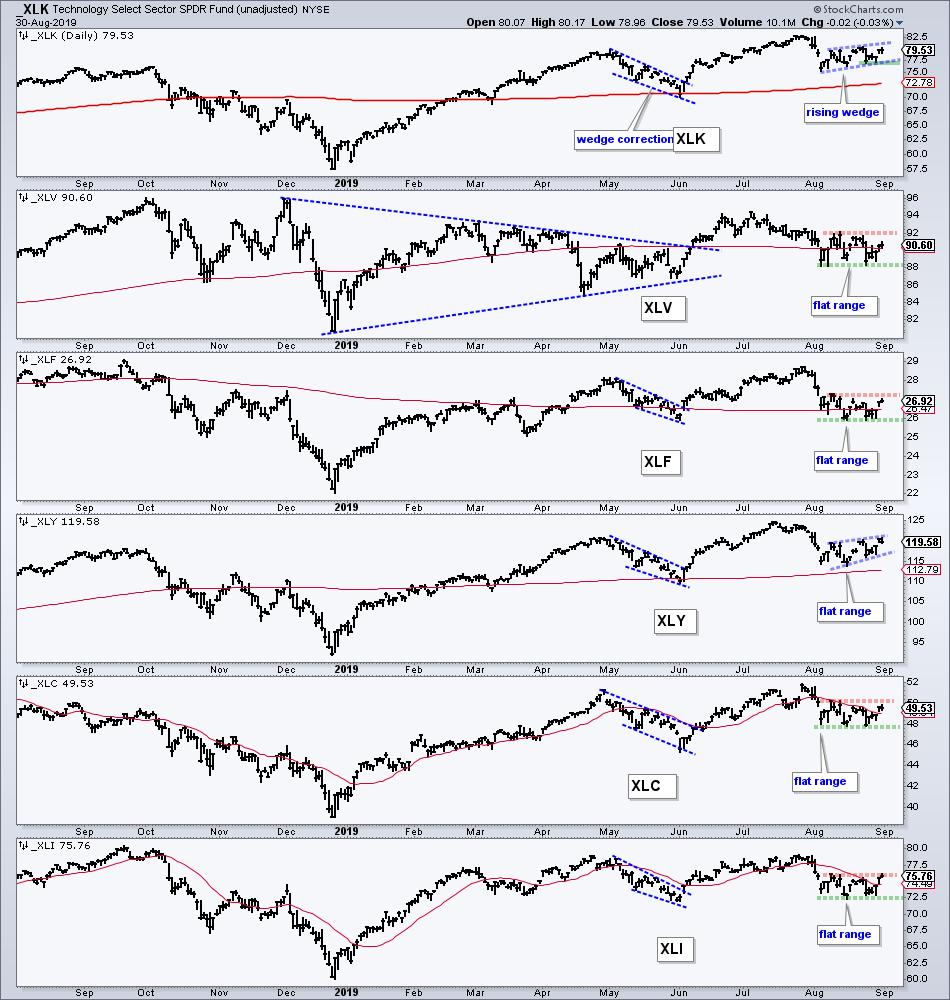
I showed this chart of the six big sectors on Friday and will show another version today. Note that these six sectors account for 78% of the S&P 500 and they are the big drivers for the index. There are two rising wedges (XLY and XLK) and four flat ranges (XLV, XLF, XLI and XLC). XLK and XLY were the only two sector SPDRs to hold above their 200-day SMAs throughout August and they carried the S&P 500 in August. A move below the late August low would break wedge support and argue for a test of the early June lows.

The other four sectors are consolidating around their 200-day SMAs (XLV, XLF, XLI, XLC). Note that they are lagging because they were flat when XLY and XLK rose (rising wedges). All four moved back above these SMAs on Thursday and then stalled on Friday. As with SPY, we need to watch these August ranges. Upside breakouts in the majority (3 of 4) would be bullish, while downside breaks in the majority would be bearish, especially if XLY and XLK join.
Choose a Strategy, Develop a Plan and Follow a Process
Arthur Hill, CMT
Chief Technical Strategist, TrendInvestorPro.com
Author, Define the Trend and Trade the Trend
Want to stay up to date with Arthur's latest market insights?
– Follow @ArthurHill on Twitter
