What if you knew the Dollar would be up 3% over the last six months? What would your prognosis be for oil and gold? Most pundits would not have a bullish forecast for gold and not expect much from oil. Nevertheless, the Gold SPDR (GLD) is up 10.70% the last six months and the Light Crude Continuous Contract ($WTIC) is up 6%.
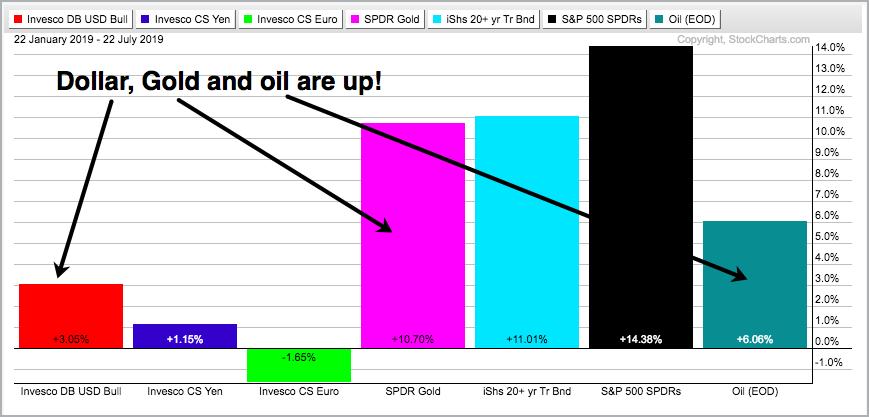 6 Month PerfChart
I am not going to search for the reasons or the rationale behind the moves in the Dollar, gold and oil. After all, I am not as crazy as I sound. There might be a perfectly logical reason, but we do not know if that is THE reason.
As far as I am concerned, there are a zillion factors at work and we cannot know them all or their weighted effect. Our job as chartists and technical analyst is to focus on the chart for the security at hand. Are you interested in gold? Great, then focus on the gold chart, and nothing else. Why? Because ... nothing else matters. Never cared for what they do. Never cared for what they know. Hat tip to Metallica for their lyrics. I will cover the Dollar and gold after the video jump.
On Trend on YouTube
Trading Strategy with BBands and Aroon
I will feature a trading strategy using Bollinger Bands and Aroon to identify a consolidation period and Aroon to identify the next directional move. There will be examples using IWM and MDY. I will also cover the banking ETFs (KRE, KBE) as well as some of the too-big-too-fail banks (BAC, C, JPM, MS, GS). This episode also includes scan code for the BandWidth/Aroon setup around the 20min mark. I will end with five stock setups and these stocks do not report earnings until September/October.
Trading Strategy with BBands and Aroon
The first chart shows the US Dollar ETF (UUP), the Euro ETF (FXE) and the Yen ETF (FXY). The Euro accounts for 57% of the Dollar ETF, while the Yen weighs 13.60%. UUP has been hitting 52-week highs since July 2018 and FXE has been hitting 52-week lows. Clearly, the Dollar is in a long-term uptrend and the Euro is in a long-term downtrend. The Yen has been in a trading range since January 2017.
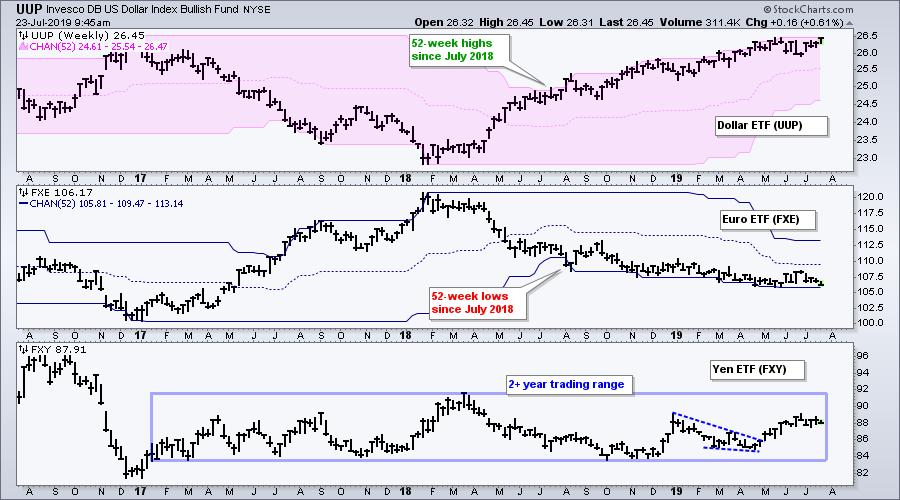 Dollar ETF Weekly Chart
The next chart shows UUP and FXE with daily bars over the past year. UUP consolidated within its uptrend, while FXE consolidated within its downtrend. A consolidation within an uptrend is a bullish continuation pattern, while a consolidation within a downtrend is a bearish continuation pattern. Their trends continued in July as UUP broke out and FXE broke down.
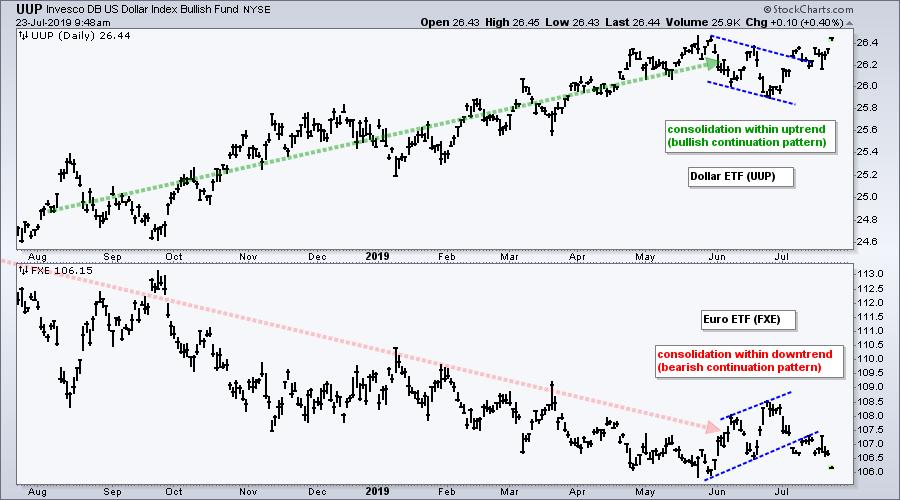 Dollar ETF Daily Chart
Now let's turn to gold. On the weekly chart, the Gold SPDR (GLD) was stuck in a consolidation from July 2017 to June 2019. The ETF broke out with double digit surge and hit new highs in mid June. This breakout is bullish, but GLD is still quite extended and could be ripe for a rest. Broken resistance turns first support in the 127-131 area.
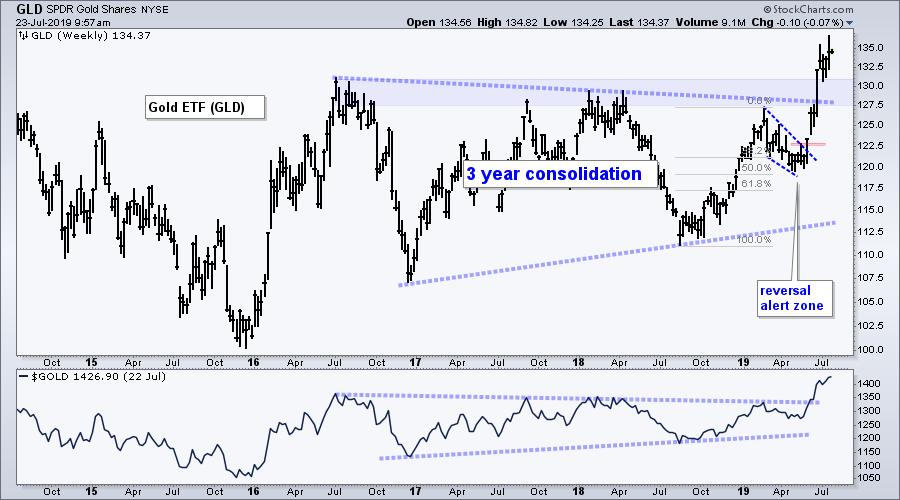 Gold ETF Weekly Chart
In general, I am not a big fan of gold (or crypto). I do, however, keep it on my radar because it can set up just like any other tradable instrument. The key is not expecting a setup every week or even every month. Setups are rare, but GLD did set up with a clear Reversal Alert Zone (RAZ) in late May and this was featured in Art's Charts. Note the falling wedge that retraced around 50% of the prior advance and the wedge breakout.
And now for the weird part. The US Dollar ETF is up around 7% since September and the Gold SPDR is up 20%. Despite both showing strong gains, the Correlation Coefficient (GLD,UUP) has been mostly negative since September. How can this be? Because the Correlation Coefficient does not account for the magnitude of the moves.
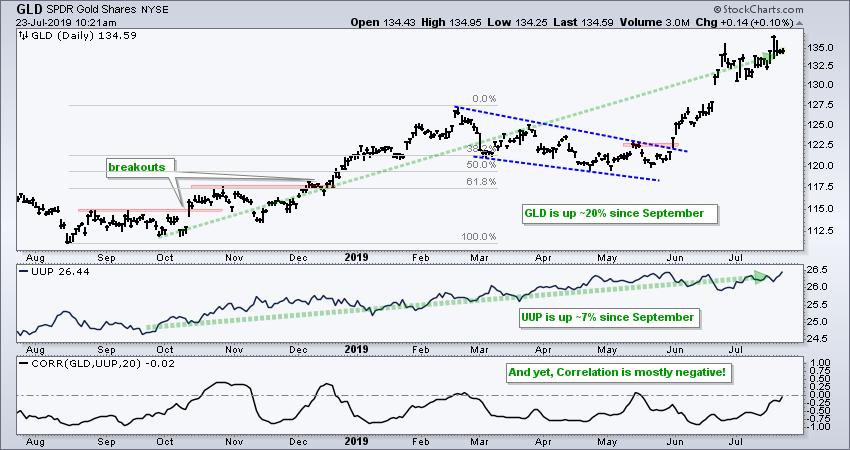 GLD Daily Chart
The Correlation Coefficient is -1 when GLD and UUP move in opposite directions. Thus, GLD could surge 3% and UUP could edge lower .05%, and the correlation would still be -1. The Correlation Coefficient is +1 when both move in the same direction. Thus, GLD could be up a fraction (.05%) and UUP could be up 1%, and the Correlation Coefficient would be +1.
As with many technical indicators, we need to be careful with the Correlation Coefficient. In fact, we are often better off simply focusing on the chart we are trading. Are you trading gold? Then focus on the chart for Spot Gold ($GOLD) or the Gold SPDR (GLD). The price chart reflects the only thing that matters. Price! We make a profit or loss based on changes in price, not in the indicator.
Choose a Strategy, Develop a Plan and Follow a Process
Arthur Hill, CMT
Chief Technical Strategist, TrendInvestorPro.com
Author, Define the Trend and Trade the Trend
Want to stay up to date with Arthur's latest market insights?
– Follow @ArthurHill on Twitter
