Art's Charts April 26, 2019 at 09:05 AM

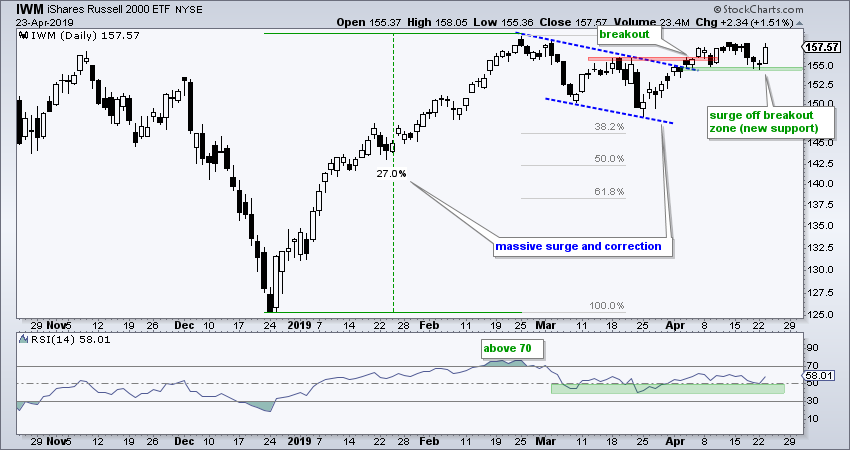
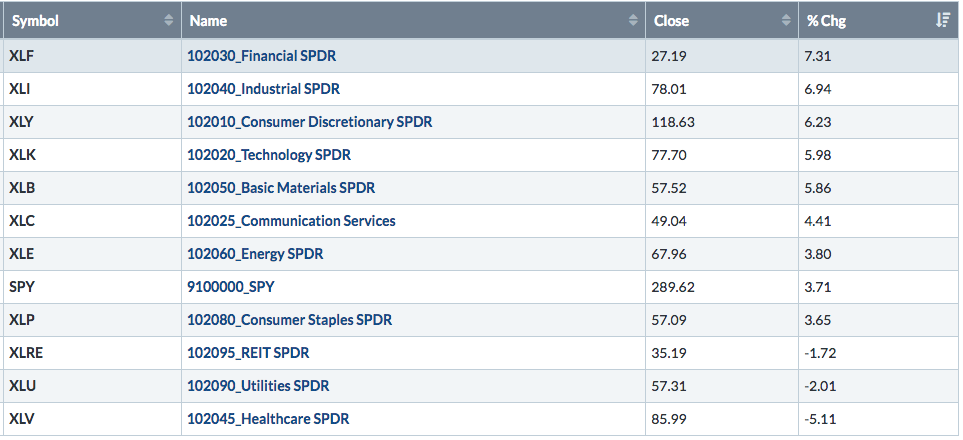
S&P 500 Reaches 2018 Highs. Watch the Immediate Uptrend. IWM Holds Flag Breakout. Small-caps Breadth Indicators Net Bearish. %Above 200-day EMA Hits Milestone for XLF. Utilities Correct within Bigger Uptrend. Stock Performance During Earnings Season. ChartList Updates... Read More
Art's Charts April 24, 2019 at 09:06 AM

Cup-with-handle Taking Shape in IWM. Bond ETFs Reach Potential Reversal Zone. Art's Charts ChartList Update (SMTC added). Art's Charts featured IWM on Monday with a bullish chart and a lagging price... Read More
Art's Charts April 22, 2019 at 10:59 AM

Small-caps Continue to Lag. S&P 500 Nears All Time High. IWM Tests Breakout Zone. Index Breadth Table Update. Industrials and Finance Come to Life. Art's Charts ChartList Update... Read More
Art's Charts April 17, 2019 at 04:46 PM

This article will provide links and symbols for some of the charts used in the On Trend episode focusing on breadth indicators (Using Breadth Indicators to Weigh the Evidence). Episode details are shown below and you can watch a recording on our Youtube channel... Read More
Art's Charts April 15, 2019 at 10:02 AM
Learning about and tracking growth stocks in unique industry groups is an ongoing process that can help traders and investors outperform the broader market... Read More
Art's Charts April 07, 2019 at 10:52 PM
This post will provide a resource link and scan code from the On Trend episodes focusing on RSI for trend-following and momentum strategies. This is a two-part series that goes from RSI basics to a twenty year backtest on stocks in the S&P 500... Read More