Art's Charts September 28, 2018 at 10:48 AM

%Above 200-day EMA. IJR and MDY Correct as QQQ Breaks Out. XLC and XLF are Lagging. XLF and Treasury Yields. Utes and REITs become Short-term Oversold. Big Biotechs are Leading Again. JAZZ Hits Reversal Area. Notes from the Art's Charts ChartList. ..... Read More
Art's Charts September 27, 2018 at 08:01 AM

QQQ Holds Up as Small-caps Fall. Finance Sector Fails to Hold Breakout. Defining the Upswing in XLF. Regional Banks and Brokers Break. Home Construction Breaks Triangle Line. ...QQQ Holds Up as Small-caps Fall ..... Read More
Art's Charts September 26, 2018 at 07:57 AM

Short-term Divided, but Long-term Bullish Small-caps Still Struggling SPY Leads as QQQ Breaks Wedge Tech-Related ETFs Hold Strong (sans SOXX) Chart Setups: ANET, QLYS, NFLX, LMT, RTN More Uptrends than Downtrends Large-caps continue to lead as SPY hit a new high last week and QQQ... Read More
Art's Charts September 21, 2018 at 10:44 AM

Where's the Selling Pressure? (RSP). Dow Theory Bull Market Confirmation New Leadership Emerges (XLV, XLI, XLF). QQQ Gets its Flow Back. IJR Flags and IWM Tests Breakout. Finance Sector Joins the Fray. Notes from the Art's Charts ChartList... Read More
Art's Charts September 20, 2018 at 08:40 AM

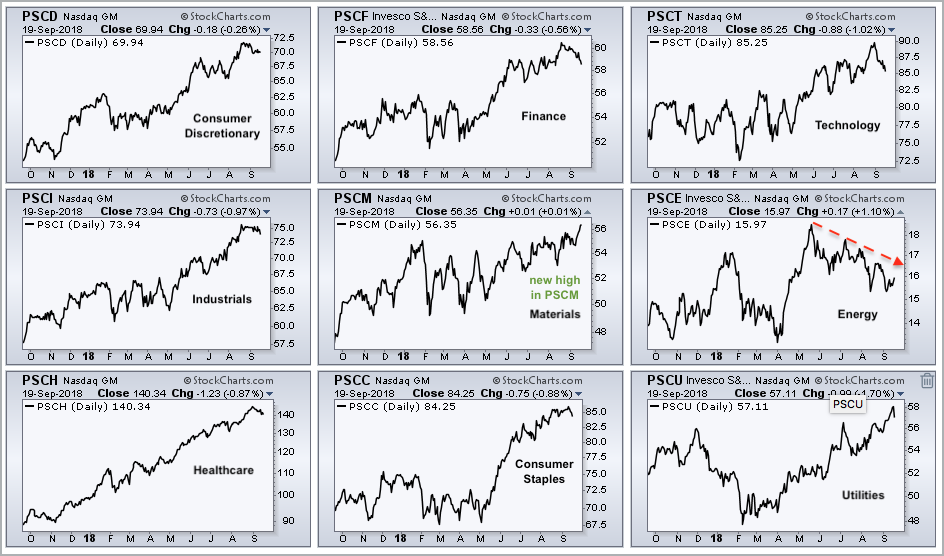
Small-cap Materials Take the Lead. An Abandoned Hammer in SOXX. FireEye, the Big Base and Volume. Arista Hits Support and Oversold Zone. ... Small-cap Materials Take the Lead ... There are nine small-caps sectors and the SmallCap Materials ETF (PSCM) is taking the lead... Read More
Art's Charts September 19, 2018 at 08:08 AM

2-yr Treasury Yield Hits 10-yr High. The Mother of All Double Bottoms. Financials SPDR Extends Stall. Leaders and Laggards in Finance. Stocks to Watch: WMT, TRN and GILD. ...Big Moves in Treasury Yields ..... Read More
Art's Charts September 14, 2018 at 10:17 AM

Market Overview - New Highs Are? Breadth Remains Strong Enough. Large-caps Lead New High List. SPX Turns Up after Mild Pullback. Small-caps Lag on Upturn. QQQ Bounces from Oversold Level. XLY and XLV hit new highs as XLK turns Up. XLI Continues to Lead as XLF Lags... Read More
Art's Charts September 13, 2018 at 09:41 AM

XLF Stalls at Resistance. IAI Breaks Triangle Line (plus key stocks). Regional Bank SPDR Falters. XLP goes from Laggard to Leader (plus key stocks). Checkpoint, Biomarin, Cerner and Walgreens. Interview with Financial Sense... Read More
Art's Charts September 12, 2018 at 09:24 AM

Large-Techs and Small-Caps Still Leading. QQQ Bounces as IJR Flags. Junk Bonds and International Indexes. Charts Worth Watching. On Trend on Youtube. ....QQQ and IJR Still Leading Year-to-Date... ...The major index ETFs are in long-term uptrends and short-term downtrends... Read More
Art's Charts September 07, 2018 at 11:17 AM

Market Overview. S&P 500 Retreats from All Time High. Would you have the Nerve? Selling Pressure Contained. XLI Exceeds Late August High. Aerospace & Defense iShares Hits New High. Lockheed Martin and Raytheon Break Out. XLU and XLP Lead and Lag. Always Defer to the Price Chart... Read More
Art's Charts September 06, 2018 at 08:23 AM

Introduction. RSI for Trend Identification. RSI to Quantify Pullbacks. Scan Code Progression. Conclusions and Tweaks... Read More
Art's Charts September 05, 2018 at 07:01 AM

XLF Shows a Little Leadership. Stocks to Watch in XLF. TLT Backs off Resistance. Two Cyber Security Stocks Bounce off Support. Ametek Ends Consolidation. Video Food for Thought. On Trend on Youtube. ...XLF Shows a Little Leadership ..... Read More