- SPY Extends Laborious Uptrend.
- Back in the Saddle.
- QQQ Maintains Leadership with New High.
- Healthcare Takes the Lead in July.
- Industrial Sector Pulls Ahead of Finance.
- Aerospace & Defense ETF Turns Up within Range.
- Mind the Gap in the Broker-Dealer iShares...
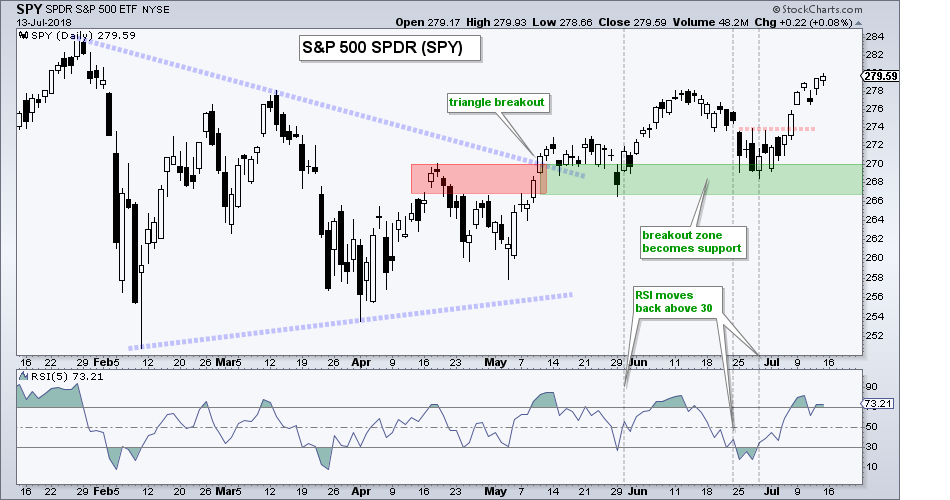
 ... The major index ETFs were in long-term uptrends and short-term oversold at the end of June (see Art's Charts for June 29th). Stocks alleviated these short-term oversold conditions with mean-reversion bounces over the last two weeks and extended their bigger uptrends. QQQ and IJR led the way with fresh 52-week highs, while SPY edged above its March high and extended its uptrend. SPY is now less than 2% from a 52-week high.
The chart below shows our market benchmark, SPY, breaking out of a large triangle in mid May and successfully testing the breakout zone in late May and late June. Notice that RSI(5) dipped below 30 three times after the breakout and these dips marked short-term oversold conditions after the breakout.
The uptrend since early April seems laborious, but it is still an uptrend with higher highs and higher lows over the last 3 1/2 months. The lows in late May and late June mark long-term support going forward. A close below 266 would break support and reverse this uptrend.
Back in the Saddle
I am back in the saddle after a two-week stint on the ring road in Iceland, which is 1332 kilometers (827 miles). The nature is stunning and diverse throughout the entire country. There are dozens of well-marked hiking trails, friendly people, tasty tap water and a midnight sun for long days. The picture below is from Jökulsárlón, which is a glacier lake in the southeast. It was a gloriously sunny day with temps around 65 degrees faahrenheit.
QQQ Maintains Leadership with New High
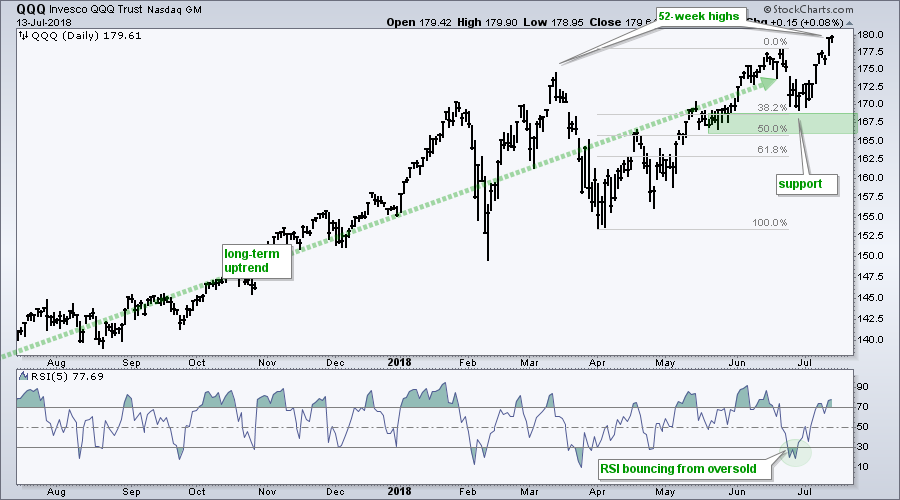
The next chart shows QQQ retracing around 38.2% of the April-June advance with a pullback to the 170 area. RSI(5) dipped into oversold territory at the end of June and the ETF firmed in early July. QQQ then reverted back to the long-term uptrend with a surge and new high. Also note that the Internet ETF (FDN), Cloud Computing ETF (SKYY) and Software iShares (IGV) hit new highs.
Healthcare Takes the Lead in July
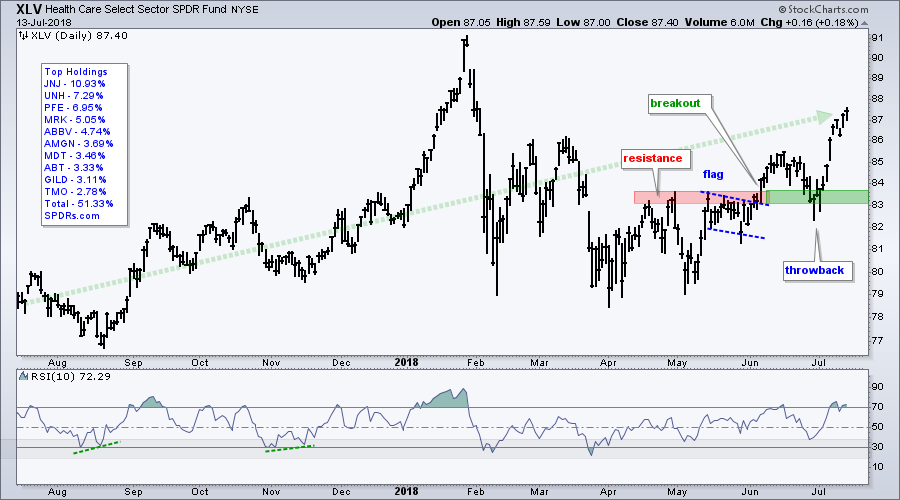
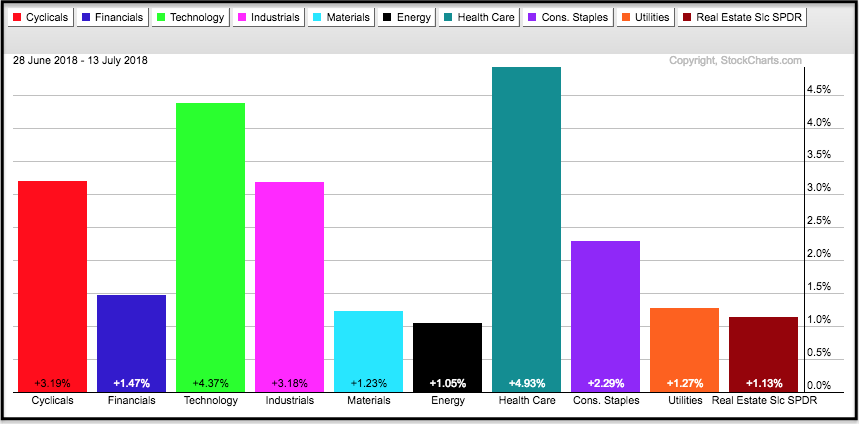
The Consumer Discretionary SPDR (12.91%) and Technology SPDR (26.4%) are the leading sectors because both recorded 52-week highs late last week. The Real Estate SPDR (2.81%) hit a 52-week high in early July and is the third leading sector. The Health Care SPDR (14.3%) gets fourth place because it led the sector SPDRs with a 4.93% gain the last two weeks and reached its highest level of the year (2018). And finally, I would put the Utilities SPDR (2.90%) in fifth place because it reached its highest level of 2018 in early July. All told, around 60% of the sector weights in the S&P 500 look strong and this is enough to support a bull market.
 The Health Care SPDR has been on my radar since the breakout in early June. Notice how the "throwback" into early July returned to the breakout zone and the ETF held this zone on a closing basis. XLV may seem short-term extended, but I continue to like healthcare going forward.
XLI Pulls Ahead of XLF
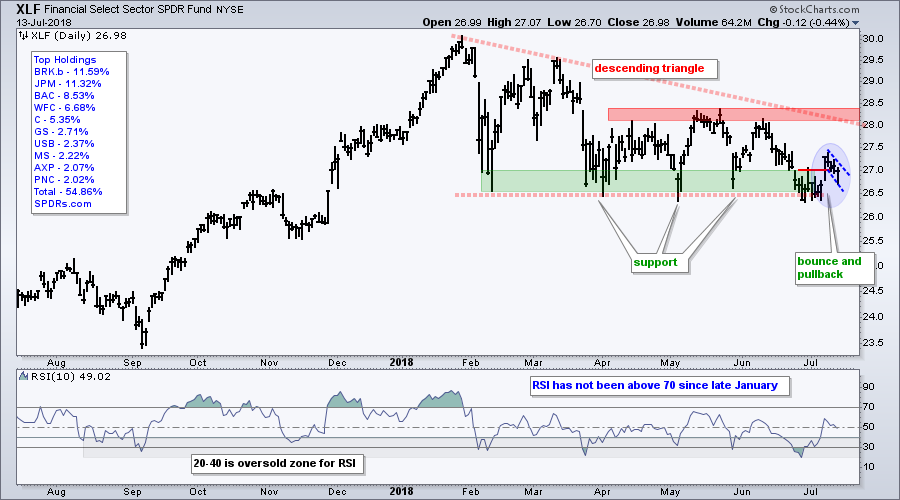
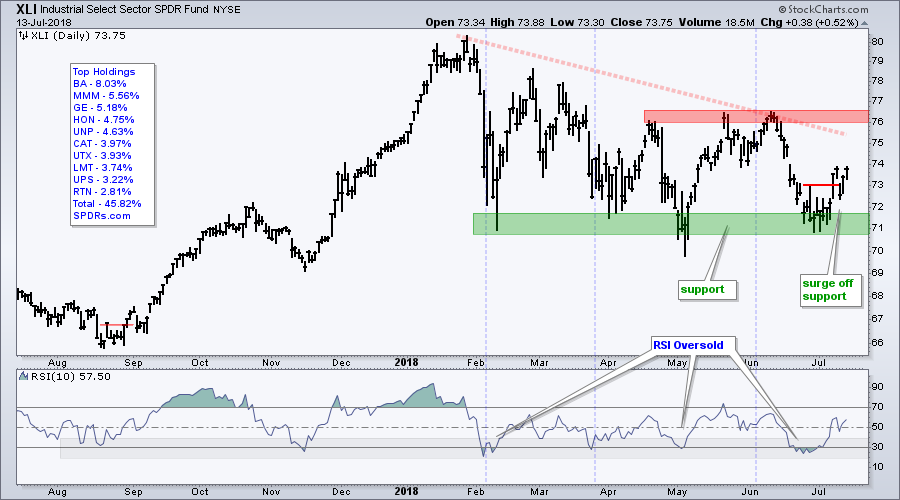
The Industrials SPDR (9.52%) and the Financials SPDR (13.73%) are still the weakest of the five biggest sectors, but it looks like XLI is pulling away from XLF. The "laborious" uptrend in SPY stems from weakness in these two sectors. Both ETFs show lower highs since late January and relatively equal lows marking support zones. The first chart shows XLI surging off support in early July, dipping below the short-term breakout and moving back above this breakout the last two days. The bigger trend remains down though and we need to see a break above the April-June highs for a full reversal.
 The next chart shows XLF with a bounce off support and a pullback that looks like a flag of sorts. Look for a breakout at 27.2 to extend the bounce and possibly lead to a resistance challenge. Note that earnings season started last week. A few big banks reported last Friday and more are scheduled this week. I have no clue on earnings, but these reports could increase volatility.
ITA Turns Up within Range
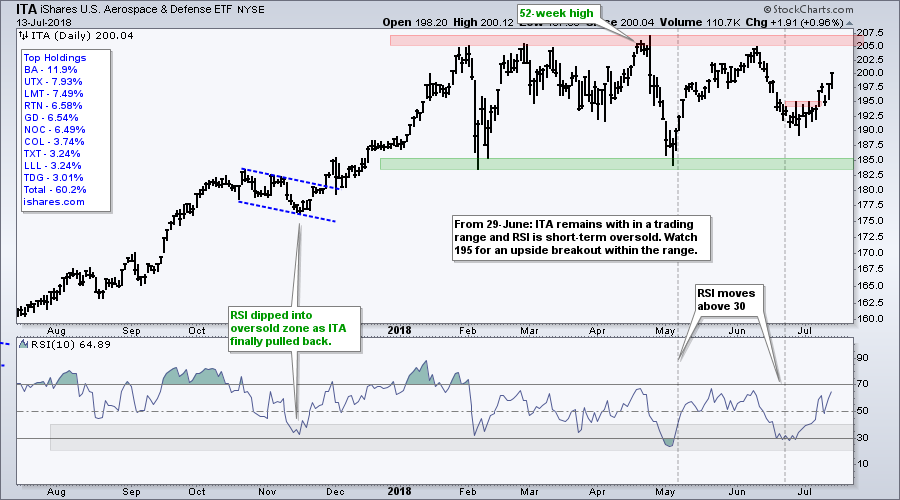
The next chart shows the iShares Aerospace & Defense ETF (ITA) with a large trading range in 2018. This range follows a 60+ percent advance from October 2016 to January 2018. Thus, it could be a big rest after a big move. Within the consolidation, ITA dipped to the 190 area and became oversold as RSI dipped below 30 in late June. The ETF is turning up with a short-term breakout and an RSI move above 30. Most of these stocks are in the Industrials SPDR so strength here would benefit the sector.
Mind the Gap in IAI
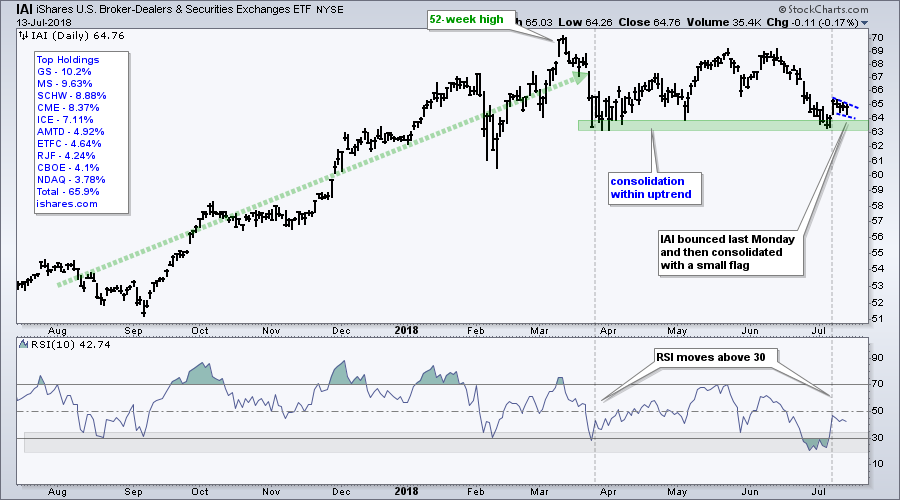
The next chart shows the Broker-Dealer iShares (IAI) with a bounce off support from the March-May lows. Also notice that RSI moved above 30 with last Monday's bounce. A small flag formed the last four days and a breakout at 65 would be short-term bullish. Note that Goldman Sachs (GS) reports on Tuesday and this stock accounts for around 10% of the ETF.
Questions, Comments or Feedback?
I cannot promise to response to all correspondence, but I will read it and take into under consideration. I greatly appreciate all feedback because it helps me improve the commentary and provides ideas for the future. Sorry, I do not take symbol requests.

Plan Your Trade and Trade Your Plan.
- Arthur Hill, CMT
Senior Technical Analyst, StockCharts.com
Book: Define the Trend and Trade the Trend
Twitter: Follow @ArthurHill

