- Throwbacks after Breakouts.
- Triangles within Bigger Uptrends.
- Stock with Fresh Breakouts.
- Corrections within Uptrends.
- Two Dozen Strong Uptrends.
 As noted in Friday's commentary, the performance of stocks in the S&P 500 is split and it a stock picker's market. I am even seeing divisions within many sectors and industry groups.
The charts in today’s commentary show stocks within the S&P 500 that have bullish setups, in my humble opinion. There are no indicators on these charts because the price action tells us all we need to know.
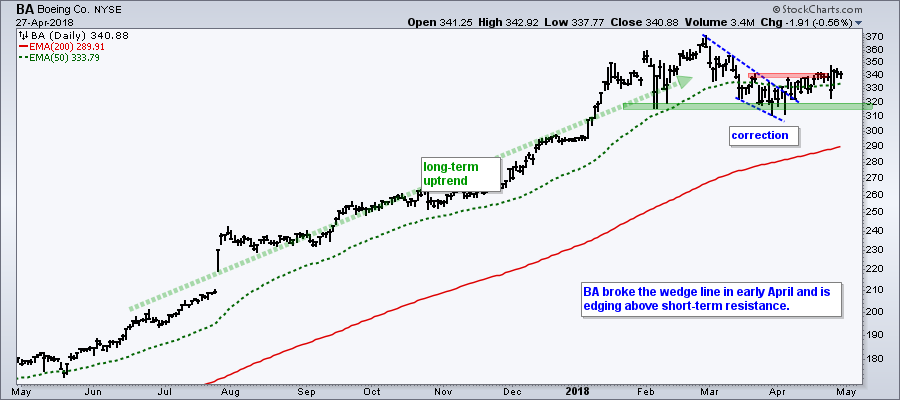
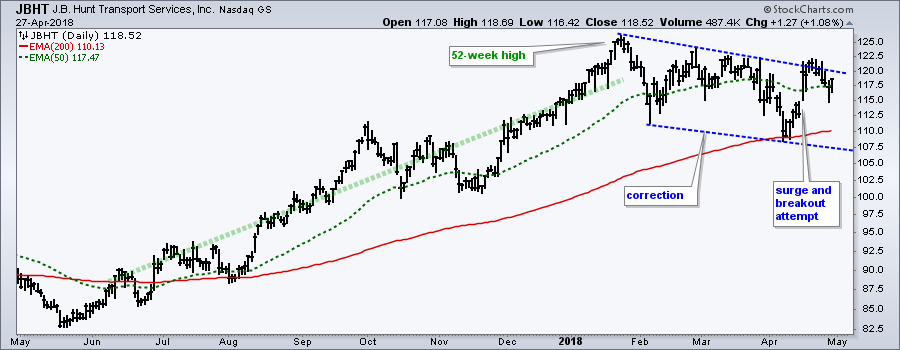
All of these stocks are in long-term uptrends. The patterns differ, but they can be broken down into four categories: throwback, breakout, consolidation and correction. A throwback refers to a pullback to the breakout zone. A breakout refers to an upside breakout from a pattern. A consolidation refers to a trading range, such as a triangle, within an uptrend. A correction refers to a pullback within an uptrend.
I skipped stocks that report earnings within the next two weeks. Be sure to check if earnings are an issue for you and make sure you do your own due diligence. I also skipped some utilities and REITs.
Throwbacks after Breakouts
The first chart shows ANSYS (ANSS) with a zigzag uptrend over the past year. The stock broke out of a correction in late April and fell back to the breakout zone with a throwback last week. A throwback is a return to the breakout zone, which should, in theory, turn into support.
Triangles within Bigger Uptrends
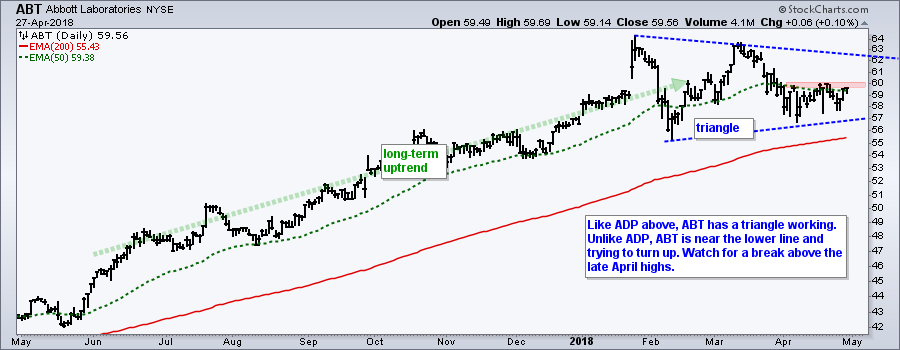
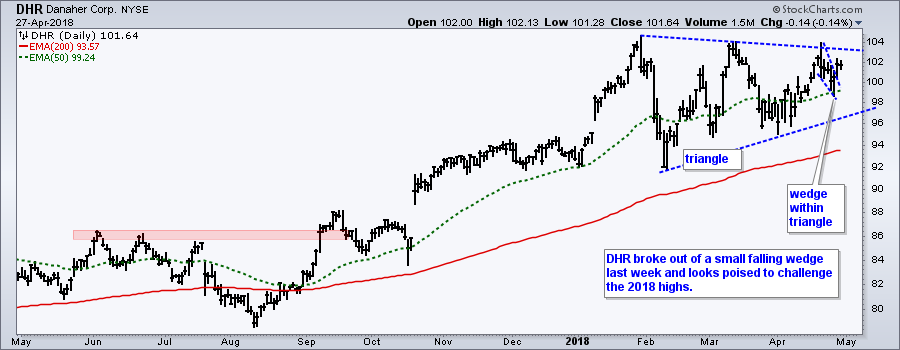
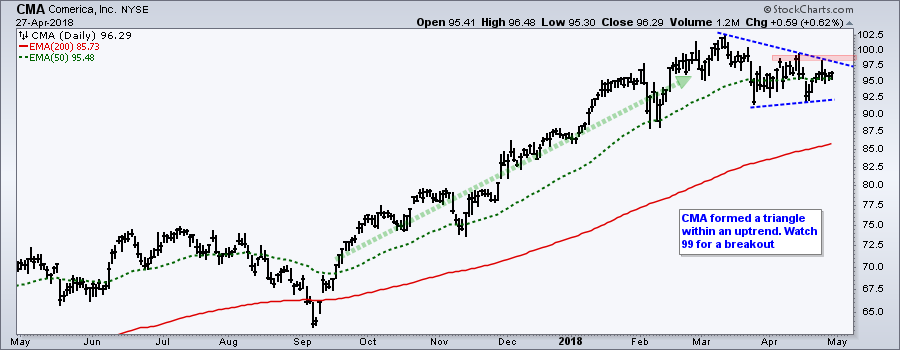
The next group shows stocks with triangle consolidations. This pattern represents a rest within the uptrend and a breakout signals a continuation of the uptrend.
Fresh Breakouts
Anthem (ANTM) shows a classic surge, correct and breakout sequence. The stock surged 40+ percent and then corrected with a decline that retraced 50-61.8% of the prior advance. ANTM firmed in this retracement zone for a few weeks and broke out last week with a surge above short-term resistance. It looks like the correction is ending and the bigger uptrend is resuming.
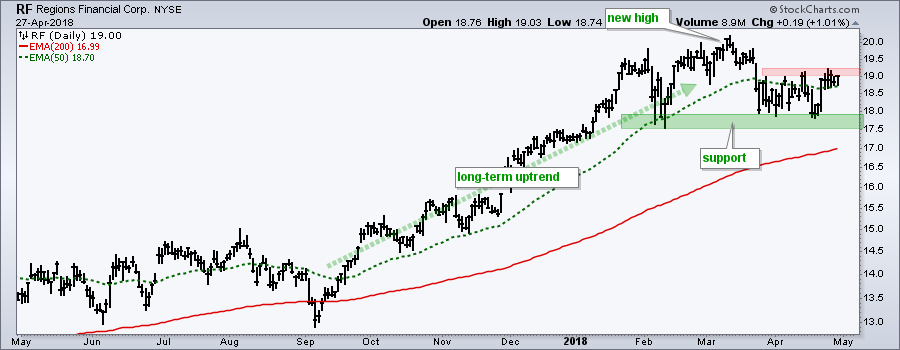
The next charts show two regional banks in long-term uptrends with new highs in March. Both traded sideways the last few months, but held support with bounces in late April. BBT is leading with a short-term resistance breakout. RF is challenging short-term resistance.
Corrections within Bigger Uptrends
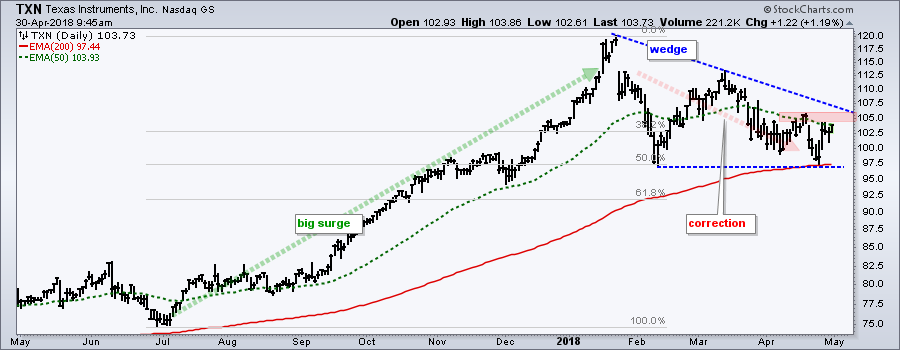
Texas Instruments (TXN) is a semiconductor stock that captures the performance of a group quite well. The stock surged from July to January and the corrected with a hard fall into February. TXN dipped below the February low in April, but this still looks like one big correction.
Notice that the decline retraced 50-61.8% of the prior decline as a falling wedge formed. Both the retracement amount and pattern are typical for corrections within bigger uptrends. A breakout at 107.5 would end this correction and signal a resumption of the bigger uptrend.
Two Dozen Strong Uptrends
The comma separated list below is for stocks in the S&P 500 with strong uptrends. I may have missed a few, but there are 24 stocks for your viewing pleasure here.
ADBE,ADM,AFL,AMZN,APC,BF.B,CSCO,INTC,INTU,MSFT,NDAQ,PVH,RHI,SYK,STX,STZ,TDG,TJX,TPR,V,VLO,VRSK,YUM,ZTS
Plan Your Trade and Trade Your Plan.
- Arthur Hill, CMT
Senior Technical Analyst, StockCharts.com
Book: Define the Trend and Trade the Trend
Twitter: Follow @ArthurHill


