- Looking for Future 52-week Highs.
- 3 Stocks with Corrections after 52-week Highs.
- Goldman Sachs Surges to a New High.
- Two Materials Stocks with Recent Upturns.

Looking for Future 52-week Highs
Stocks in long-term uptrends are more likely to hit 52-week highs than stocks in downtrends. Furthermore, stocks that hit 52-week highs recently, and pulled back, are also more likely to hit 52-week highs, as opposed to stocks that are nowhere near 52-week highs.
In general, I am looking for bullish setups in stocks that are already in long-term uptrends or recently recorded 52-week highs. These stocks have the bigger trend on their side and the bigger trend is the dominant force at work.
These seemingly obvious statements are an important part of my stock selection process.
In particular, I am always interested in stocks that correct after hitting 52-week highs. A pullback or consolidation represents a correction within the bigger uptrend and I am looking to time the end of this correction. Put another way, I am interested in stocks that have a good chance of hitting a 52-week high within a few weeks.
3 Stocks with Corrections after 52-week Highs
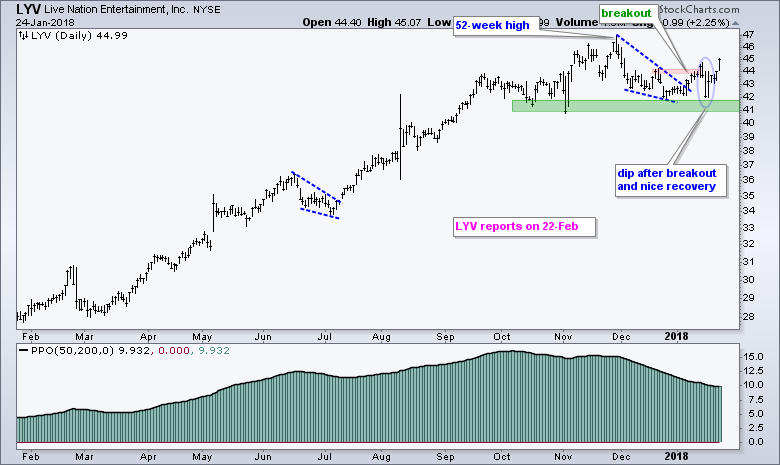
The next three charts show stocks that hit 52-week highs within the last few months and then corrected. Live Nation (LYV) corrected in December and then appeared to break out in mid-January. The stock fell back rather sharply after the breakout, but rebounded nicely the last five days and it looks like the breakout is on again. More importantly, it looks like the bigger uptrend is continuing. The indicator window shows the PPO(200,50,0) in postiive territory.
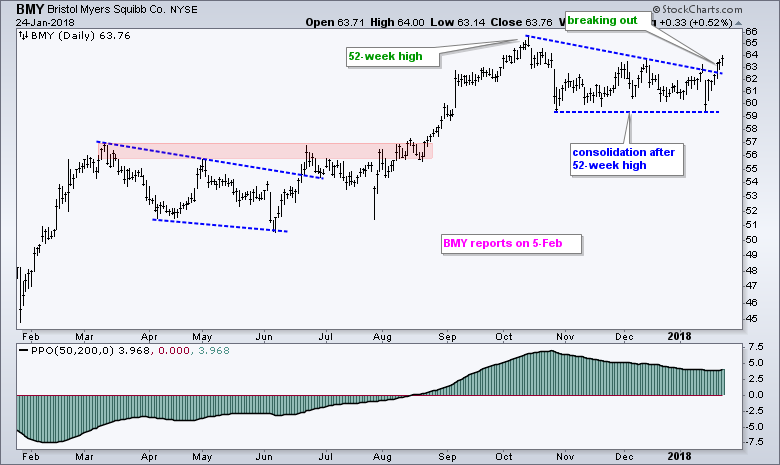
Bristol Meyers (BMY) is part of the healthcare sector, which is one of the leading sectors in 2018. The stock is lagging a bit because it has yet to hit a fresh 52-week high, but I view the consolidation as a rest within the bigger uptrend. The stock made some waves this week with a break above the triangle line and it looks like the bigger uptrend is continuing.
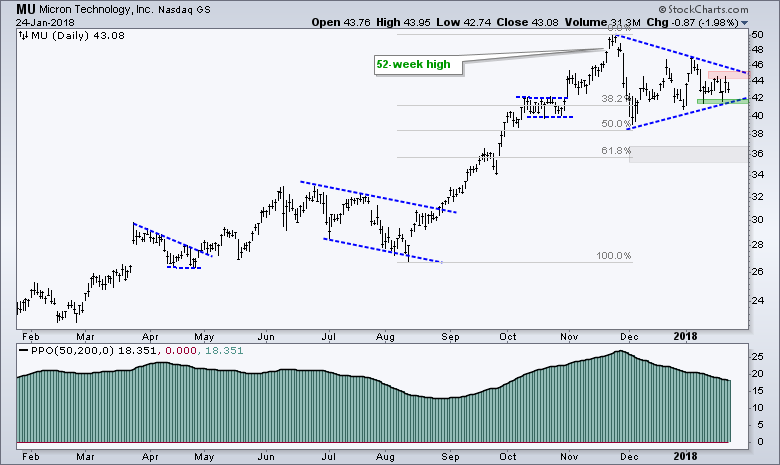
Micron Technology led the market from mid-August to late November with an 80+ percent advance and a 52-week high. The stock then moved into corrective mode with a triangle forming the last eight weeks. An upside breakout at 45 could end this consolidation and signal a continuation higher. Triangles can go either way so chartists should also watch support, a break of which would target a move to the 61.8% retracement.
Goldman Sachs Surges to a New High
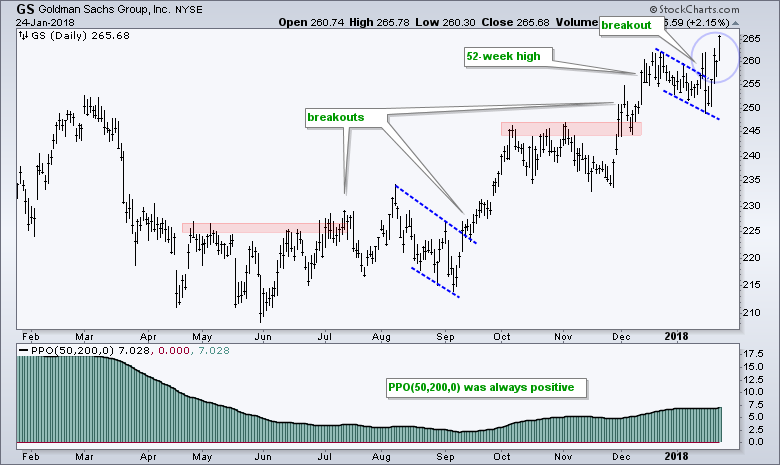
The finance sector and big banks are performing well this year with 52-week highs coming from Citigroup (C), Bank of America (BAC), JP Morgan (JPM) and Morgan Stanley (MS). Goldman Sachs (GS) hit a new high in late December, corrected into mid-January and broke out with a surge the last few days. This breakout signals a continuation of the long-term uptrend and I would expect further gains from Goldman in the coming weeks.
Two Materials Stocks with Recent Upturns
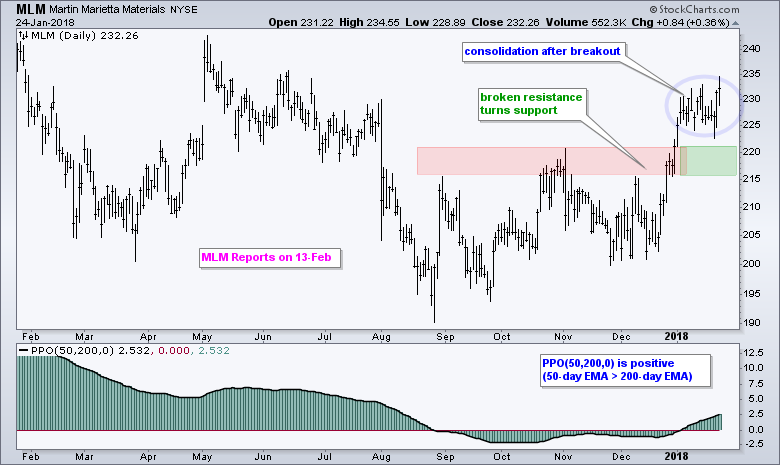
The next two stocks come from the materials sector and they were featured in Art's Charts on January 2nd. Martin Marietta (MLM) broke out in early January and the 50-day EMA moved above the 200-day EMA (PPO(50,200,0) turned positive). The stock consolidated after the breakout and I view this as a rest after the breakout surge. A consolidation within an uptrend is a bullish continuation pattern and I expect a continuation at some point. A close below 215 would warrant a re-evaluation.
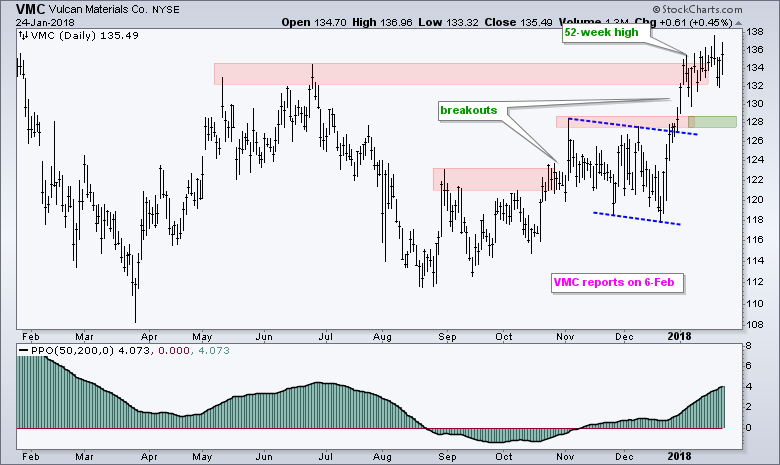
The second chart shows Vulcan Materials (VMC) with two smaller breakouts in route to a 52-week high in early January. Trading turned quite choppy the last few weeks, but the last breakout in the 128 area is holding and this level marks first support.
Plan Your Trade and Trade Your Plan.
- Arthur Hill, CMT
Senior Technical Analyst, StockCharts.com
Book: Define the Trend and Trade the Trend
Twitter: Follow @ArthurHill

