.... Oil Could Hit Resistance Soon
.... Oil & Gas Equipment & Services SPDR Lags Crude
.... Chevron Leads as ExxonMobil Lags
.... Goldman Finds Support as Schwab Turns Up
.... Loews and Travellers Lead Insurance Industry
.... Bristol Meyers Fills Gap with Big Move ....
Oil Could Hit Resistance Soon
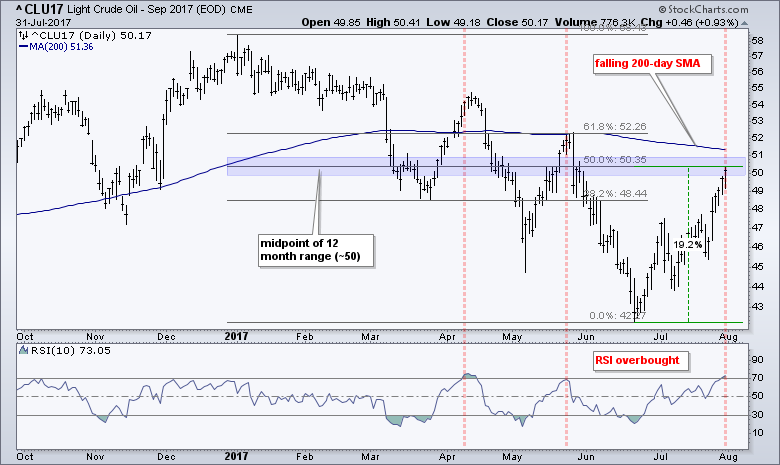
The rally in crude could run out of steam soon. I am not making a bearish call on crude, but September Light Crude (^CLU17) could hit resistance soon and stall. Technically, crude is still in a long-term downtrend with lower lows and lower highs throughout 2017. The 200-day SMA is also falling. Crude surged some 19% off the June low and closed above $50 for the first time since May. The $50 area marks the mid point of the 12 month range. This does not warrant resistance, but the crude is the most overbought since mid April and ripe for a rest.
Oil & Gas Equipment & Services SPDR Lags Crude
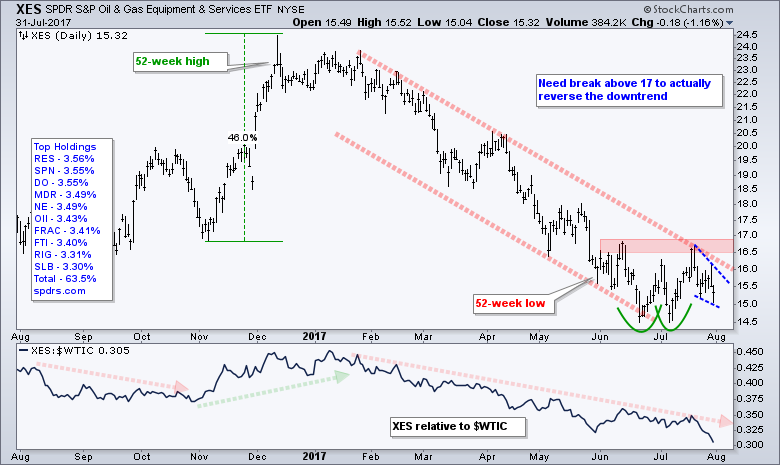
It is quite interesting that the Oil & Gas Equip & Services SPDR (XES) did not break out and follow crude higher. I would expect XES to be trading in the 18-19 range after a 19% surge in crude. Instead, XES remains below the June high and continues to underperform crude. The indicator window shows the XES:$WTIC ratio falling to a new low on Monday. Looking at the price chart, the red trend lines mark a falling channel to define the overall downtrend. The green parabolas mark a small double bottom and support in the 14.5 area. The blue lines mark a small falling wedge the last eight days. A wedge breakout at 16 would provide the first clue that XES is ready to play catch-up with crude and break resistance.
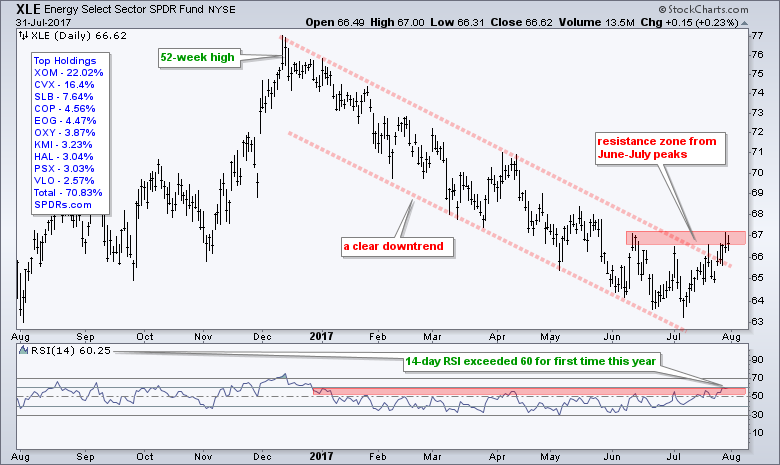
The next chart shows the Energy SPDR (XLE) advancing to its resistance zone with a move to the 67 area. This move broke the channel trend line and RSI moved above 60 for the first time this year. Downside momentum is clearly slowing, but the ETF remains short of a full-blown trend reversal and breakout.
Chevron Leads as ExxonMobil Lags
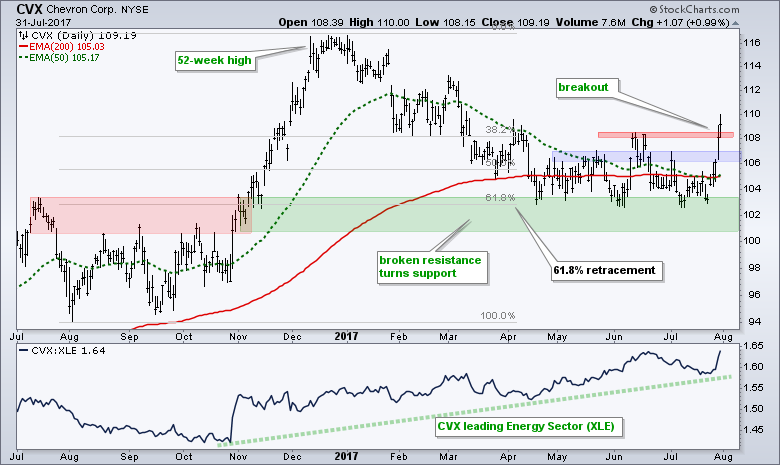
The Energy SPDR (XLE) is being hampered by ExxonMobil (XOM) and helped by Chevron (CVX). XOM accounts for a whopping 22% of XLE and CVX weighs in at 16.40%. The first chart shows CVX breaking above its June high and leading the energy sector. The breakout near 108 is bullish, but this is just an observation, not a tradable setup. CVX is already up almost 6% in six days and ripe for a short-term rest. The blue zone marks a potential support area to watch on a throwback.
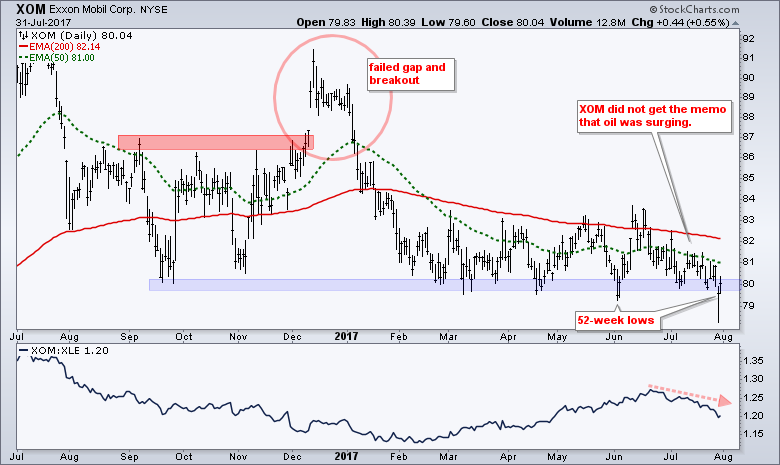
The second chart shows XOM wallowing near a 52-week low and lagging the energy sector. Oil is up double digits from its June low and XOM is down around 4% from its June high. XOM obviously has other issues affecting the stock. Nevertheless, there is a case to be made for support in the 80 area and this support extends all the way back to September.
Goldman Finds Support as Schwab Turns Up
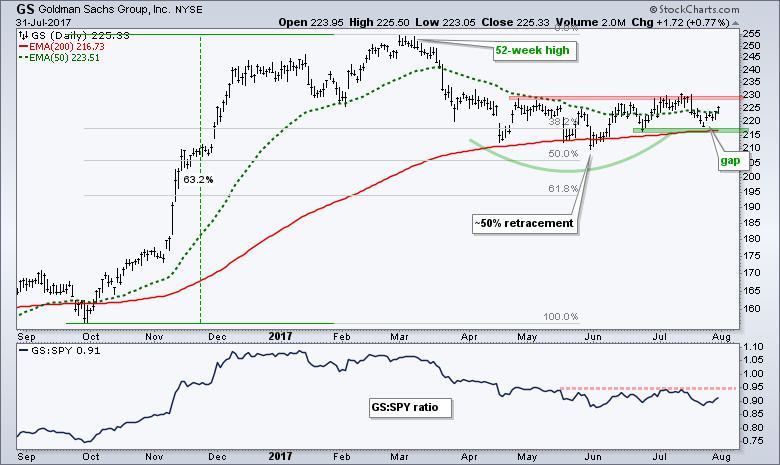
Goldman Sachs (GS) has been lagging the market this summer, but I do not want to bet against Goldman. The chart shows GS hitting a new high in late February and then retracing 50% of a monster advance. The stock returned to the 200-day EMA and found support in the 210-215 area from April to July. The green parabola shows a slight upturn at work since June, but GS remains short of a convincing breakout at 230 (red resistance zone). Short-term, the stock turned up with a gap up five days ago and nice bounce the last two days. Support is set at 215 and a break here would fill the gap and be bearish.
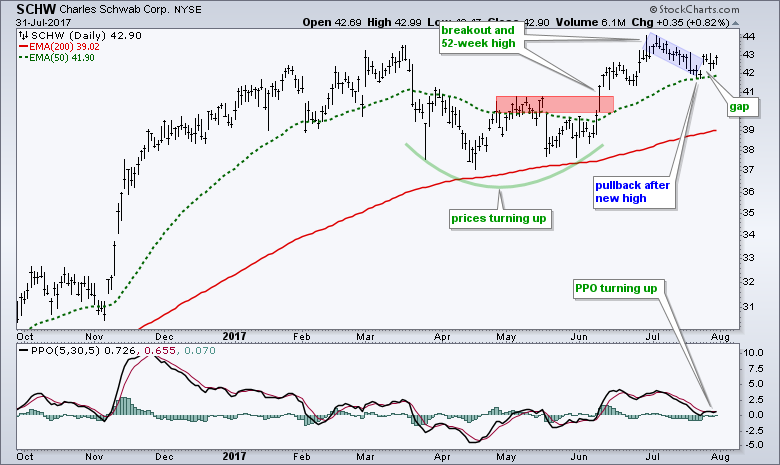
Discount brokers TD Ameritrade (AMTD), E*Trade Financial (ETFC) and Schwab (SCHW) hit 52-week highs in July and this is a bullish sign for the market (brokers are performing well). The chart below shows Schwab hitting a 52-week high in early June and pulling back to the 50-day EMA (green dashed line). The stock gapped up five days ago and this gap is largely holding. It looks like the uptrend is resuming after the pullback. Also notice that the PPO (5,30,5) turned up and moved above its signal line.
Loews and Travellers Lead Insurance Industry
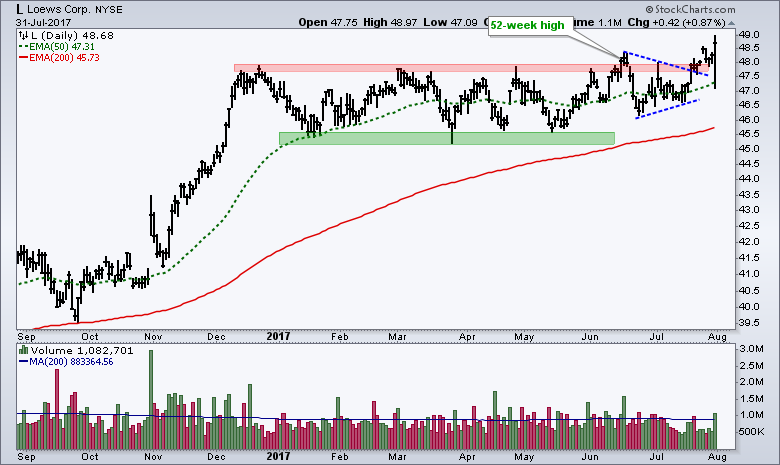
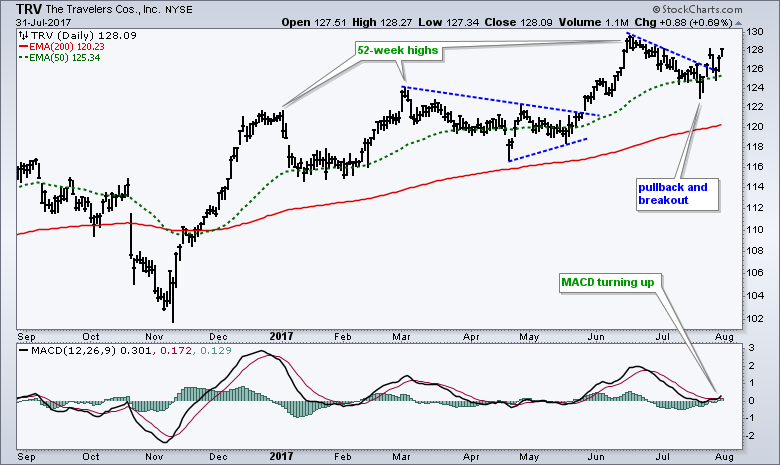
In keeping within the finance sector, the next two stocks come from the insurance industry and feature in the Insurance SPDR (KIE). The first shows Loews (L) breaking out of a long consolidation with 52-week highs in mid June and late July. The second shows Travellers (TRV) with new highs throughout 2017 and a pullback from mid June to late July. The pullback appears to be ending with the breakout and MACD upturn over the last few days.
Bristol Meyers Fills Gap with Big Move
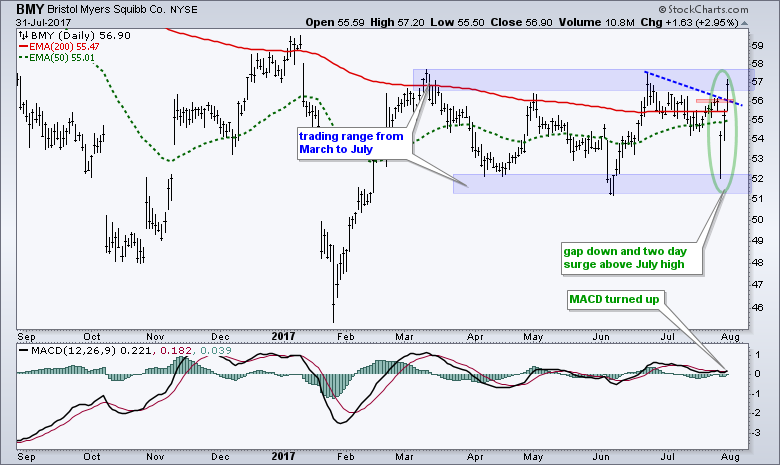
Bristol Meyers has been a violent stock with little direction over the past year. The stock was in the mid 50s in September last year and is currently in the mid 50s. Nevertheless, a breakout could be in the making after a recent gap recovery. BMY surged from late January to mid March and then moved into a trading range. The stock is still stuck in the range, but I was impressed with the ability to recover from Thursday's gap. In addition to filling the gap, the stock surged above the July high with a move on Friday and Monday. It now looks like a trading range breakout could be in the making.
******************************************************
ETF Master ChartPack - 300+ ETFs organized in a Master ChartList and in individual groups.
Follow me on Twitter @arthurhill - Keep up with my 140 character commentaries.
****************************************
Thanks for tuning in and have a good day!
--Arthur Hill CMT
Plan your Trade and Trade your Plan
*****************************************

