Art's Charts February 28, 2017 at 08:58 AM
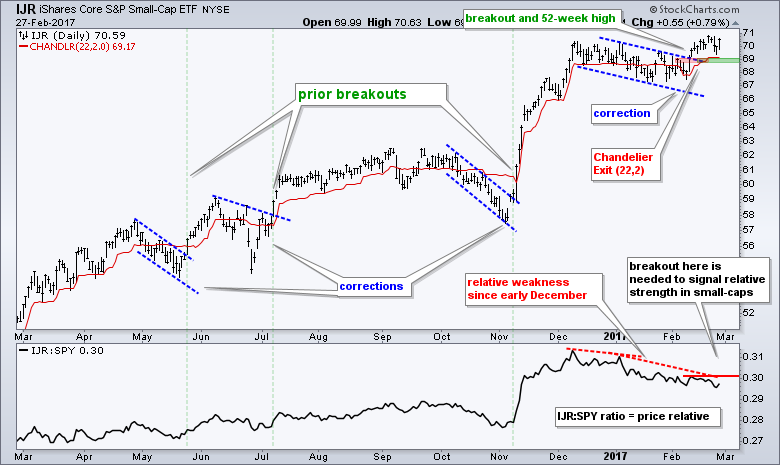
.... Small-caps Hold Breakout, but Still Lag .... A Classic Throwback for Nucor .... Oil Remains Stuck in Consolidation .... Watch the Big Three (XOM, CVX, SLB) for Clues on XLE .... Two Oil Refiner Stocks (MPC, VLO) ...... Read More
Art's Charts February 25, 2017 at 05:33 AM
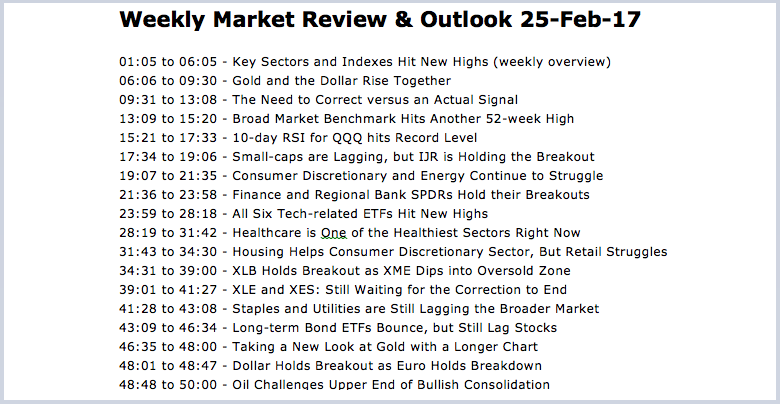
----- Video Link ----- Art's Charts ChartList (updated 25-Feb) ----- Key Sectors and Indexes Hit New Highs The stock marked notched more new highs this week as the major index ETFs hit new highs during the week (SPY, DIA, IWM, IJR, MDY, QQQ)... Read More
Art's Charts February 24, 2017 at 03:00 AM

.... Introduction .... Testing During Two Bear Markets .... Universe, Timeframe and Data .... Using S&P 500 as a Market Filter .... Trend-Timing System using the PPO .... Scaling into the S&P 500 .... Momentum-Rotation System using Rate-of-Change ...... Read More
Art's Charts February 21, 2017 at 09:18 AM
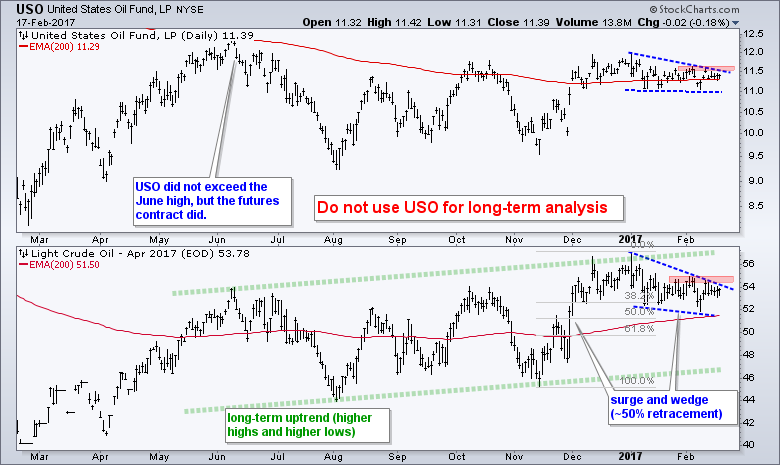
.... Oil Bounces within Corrective Pattern .... Measuring the Correlation between Oil and Energy ETF .... XLE, XES and XOP Correct Along with Oil .... Focus on Gold for Precious Metals ETFs .... Watching the Wedge and Fib Retracement in Gold .... 14 Bullish Stock Charts ...... Read More
Art's Charts February 18, 2017 at 06:43 AM
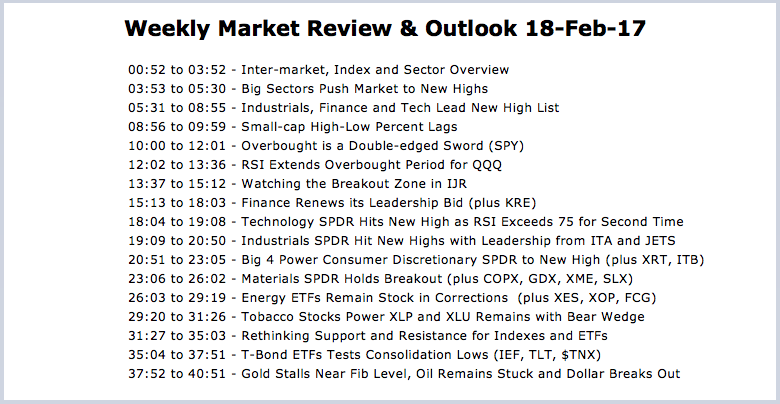
----- Video Link ----- Art's Charts ChartList (updated 18-Feb) ----- Programming Note: The Art's Charts Chartlist has been updated with 30 annotated charts covering the industry group ETFs... Read More
Art's Charts February 16, 2017 at 08:01 AM
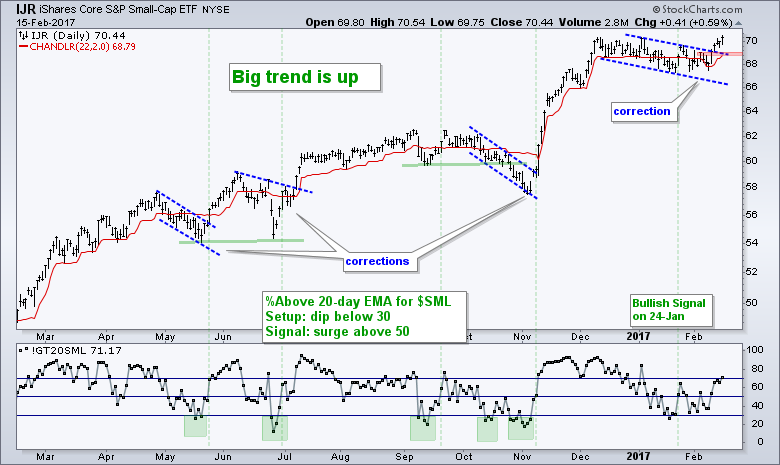
.... Small-caps Join the New High Parade .... Housing and Retail Come to Life .... Equal-Weight Consumer Discretionary Sector Breaks Out .... Five Housing Stocks to Watch (DHI, FBHS, KBH, SKY, TOL) .... Commercial Metals Resumes Bigger Uptrend ...... Read More
Art's Charts February 14, 2017 at 11:02 AM
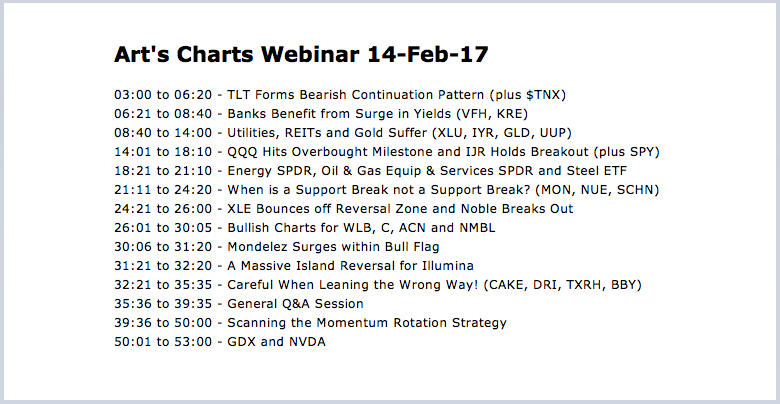
TLT Forms Bearish Continuation Pattern There is not much change in the broad market environment. The long-term trends are up, but SPY and QQQ are looking extended and ripe for a rest. IJR already got its rest and broke out on Friday to end its corrective period... Read More
Art's Charts February 11, 2017 at 06:51 AM
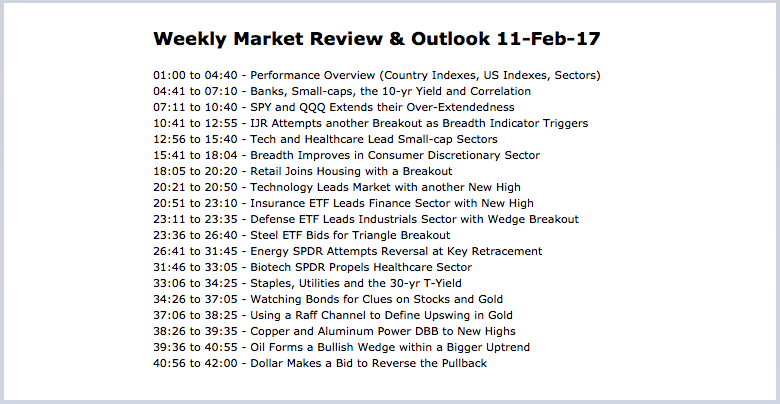
----- Video Link ----- Art's Charts ChartList (updated 11-Feb) ----- Banks, Small-caps and the 10-yr Yield Stocks extended their uptrends with the S&P 500, S&P MidCap 400 and Nasdaq 100 hitting new highs this week... Read More
Art's Charts February 09, 2017 at 11:19 AM

---- Introduction ---- Trading Universe and Timeframe ---- Culling the Herd ---- Volatility Filter ---- Minimum Liquidity Filter ---- Minimum Price Filter ---- Maximum Rate-of-Change Filter ---- Setting the Trading Rules ---- Backtest Results ---- Conclusions, Scan Code and FAQ -... Read More
Art's Charts February 07, 2017 at 08:18 AM
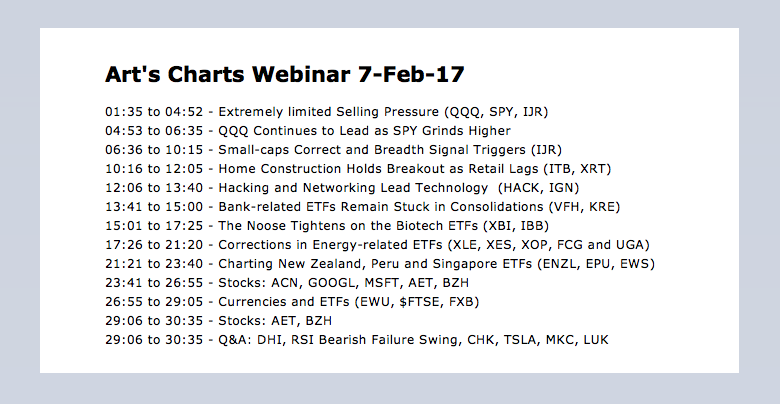
----- Webinar Video ----- Art's Charts ChartList ----- Today I will start out with simple close-only charts for SPY, QQQ and IJR. Close-only charts filter out the intraday noise and gaps that may occur between sessions... Read More
Art's Charts February 04, 2017 at 09:04 AM

Weekly Performance Review There was a lot of pushing and shoving in the markets this week. Stocks started the week with a modest move lower and finished the week with a modest move higher. The end result was a .16% gain for the S&P 500 SPDR... Read More
Art's Charts February 02, 2017 at 09:26 AM
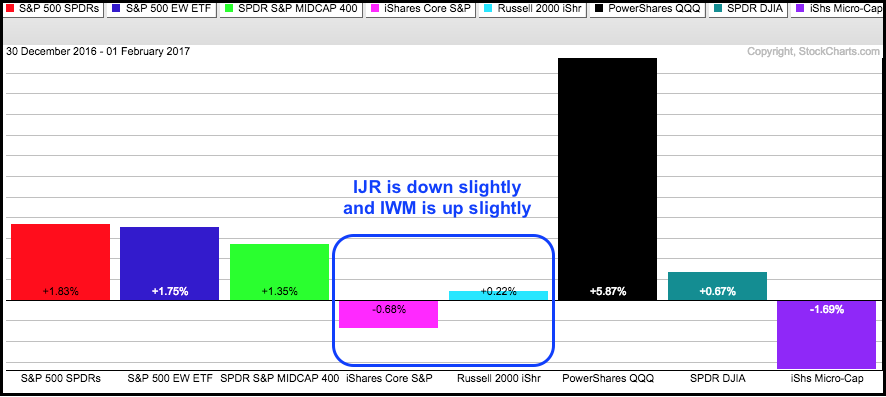
Blame Small-Caps for Mixed Up Market .... A Big Surprise for the 3rd Leading Sector .... Breadth Indicators Trigger for Healthcare Sector .... XLV Moves back above Long-term Moving Averages .... Biotech ETFs Spring Back to Life .... Emerging Markets ETF Nears 52-week High ...... Read More