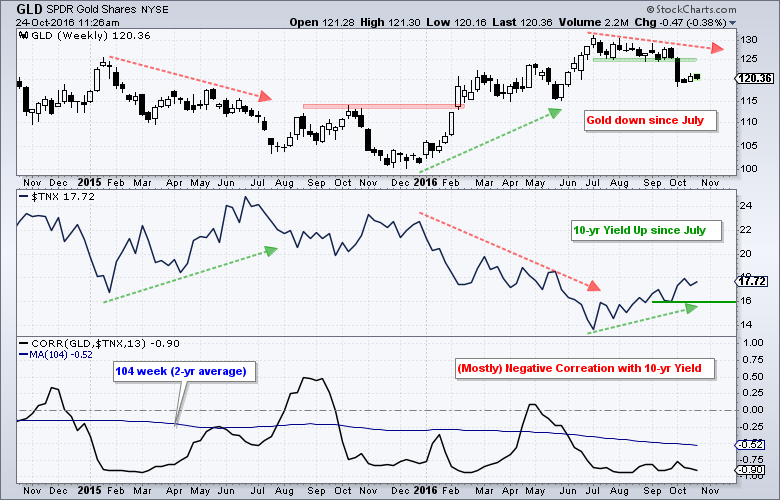
Investors looking to time gold should pay close attention to the 10-yr Treasury yield because these two show a strong negative correlation over the last two years. This means they move in opposite directions. The chart below shows the Gold SPDR (GLD), the 10-yr T-Yield ($TNX) and the 13-week Correlation Coefficient (GLD,$TNX). The red and green arrows mark three significant moves in GLD and $TNX. First, GLD fell from January to July 2015 as the 10-yr Yield rose. Second, GLD advanced from January to May as the 10-yr yield fell sharply. Third, the 10-yr Yield moved higher from July to October and GLD moved lower. These two are clearly opposites.
Chartists can quantify the correlation between the two using the Correlation Coefficient (GLD,$TNX). I prefer weekly charts when measuring correlation and use 13 weeks for the look-back period, which represents a quarter or three months. The Correlation Coefficient spent most of its time in negative territory with three excursions above the zero line. These, however, did not last long. The thin blue line shows the 104-week moving average of the Correlation Coefficient in negative territory the entire time. Currently, the two-year average of the 13-week Correlation Coefficient is at -.52 and this clearly shows a negative relationship between the two. I would expect gold to remain under pressure as long as the 10-yr T-Yield holds above 1.6% (16 on the chart).
****************************************
Thanks for tuning in and have a great day!
--Arthur Hill CMT
Plan your Trade and Trade your Plan
*****************************************

