Never Underestimate the Power of the Trend
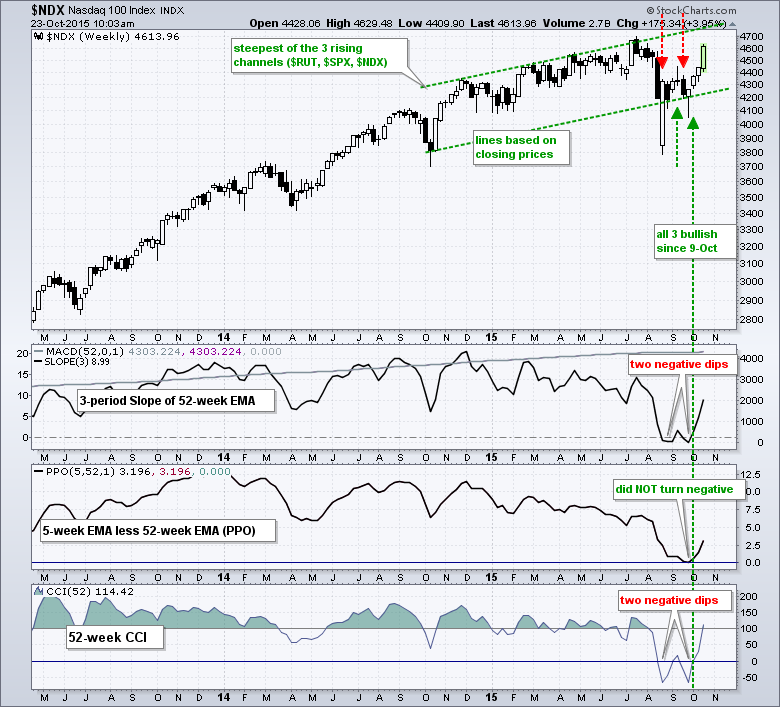
An important change occurred over the last two weeks as the overall market environment moved from bearish to bullish. The weekly trend for the Nasdaq 100 turned back up on October 9th and the weekly trend for the S&P 500 turned up on October 16th. Even though last week's big advance caught many off guard, the bigger uptrend provided a tailwind that should not be ignored. The weekly trend for the Russell 2000 remains down, but two of the three trends are up and this is bullish for the market as a whole. As noted in Friday's report, I am not that concerned with relative weakness in IWM because small-caps have historically underperformed large-caps until late November.
It is important to define the broad market trend because this sets my trading bias. I favor bullish setups when the broad market bias is bullish. When the broad market bias is bearish, I am either out or favoring bearish setups. As we have seen over the last three weeks, it is very difficult to make money on the short side of the stock market. Setups and signals come from price patterns and short-term indicators, such as the PPO (5,30,5). For example, I will now be looking for the PPO (5,30,5) to dip towards the zero line for a bullish setup and then break above its signal line for a bullish signal.
Short-term PPO Saves the Shorts
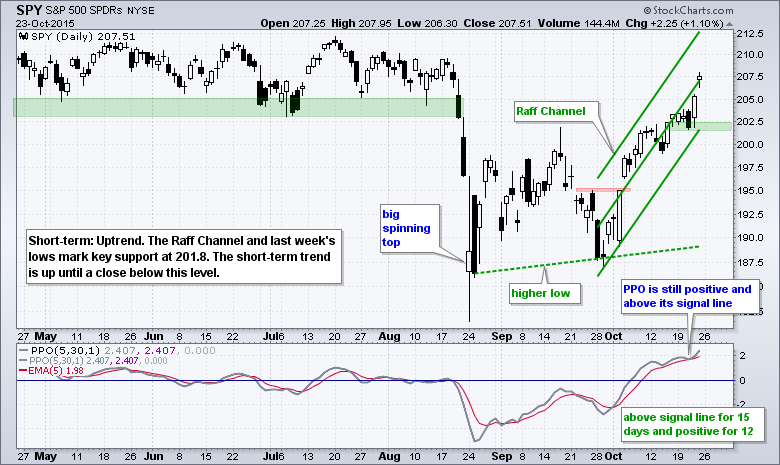
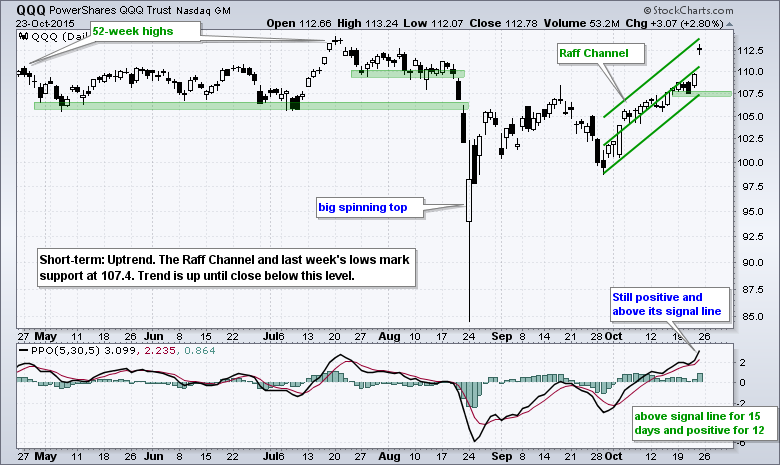
The short-term trends for SPY and QQQ have been up since the second week of October. It does not happen very often, but this means the short-term uptrends carried SPY and QQQ from an overall bearish bias to an overall bullish bias. Now what? I wait for the next short-term setup to materialize. It may take a week or it may take a month. Nobody knows. On the price charts, SPY and QQQ moved to new highs for the move and I extended the Raff Regression Channels accordingly. Last week's lows and the reward-to-risk ratio mark first support. A pullback to this area may provide the next short-term setup.
The short-term PPO (5,30,5) for QQQ has been above its signal line for 15 days and positive for 12. Ditto for SPY. This indicator is far from perfect, but this simple oscillator would have kept one on the right side of the short-term trend. For traders with a bearish bias, the rising PPO (5,30,5) would have prevented short positions because it never turned down. For those with a bullish bias, it would have kept them in the move because it just kept on rising.
Small Bullish Pattern Forms in IWM
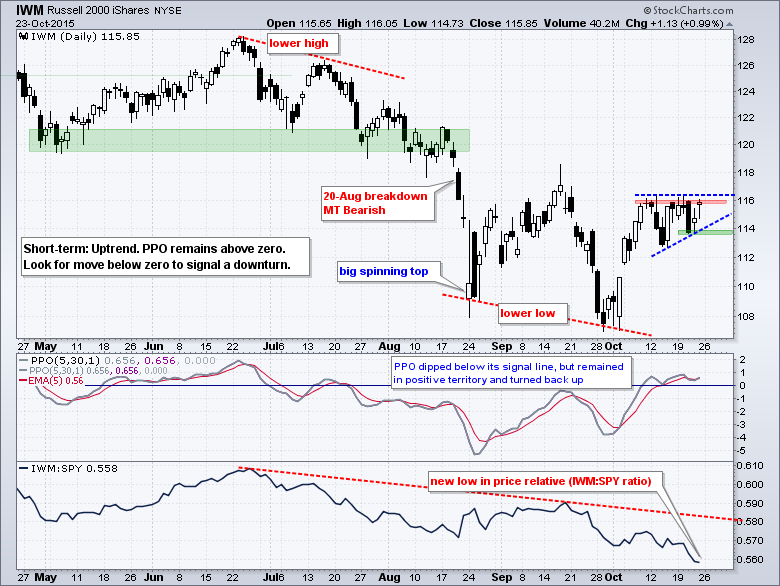
IWM remains in a downtrend overall because it formed a lower low in late September and has yet to break its mid September high. The ETF also shows relative weakness as the price relative (IWM:SPY ratio) moved to a new low. Short-term, a move below last week's low and a PPO cross into negative territory would reverse the uptrend. As long as SPY and QQQ hold up, I would also entertain the possibility that a small ascending triangle is taking shape the last three weeks. A break above the October highs would be short-term bullish and could spark a move to the low 120s.
Gold Corrects after Higher High
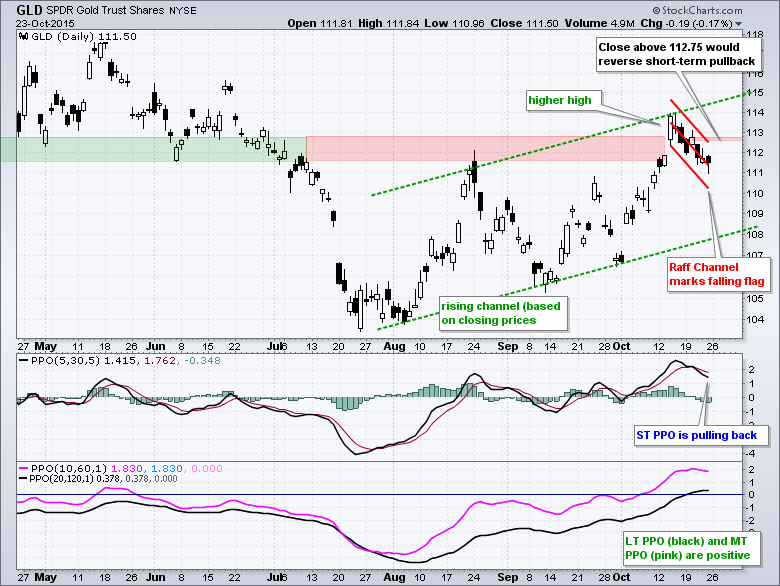
The Gold SPDR (GLD) is at an interesting juncture after a higher high in mid October and a pullback the last seven days. Notice that there is a rising channel over the last few months and the long-term PPO (20,120,1) turned positive last week. Combined with a positive medium-term PPO, this is the first sign that the bigger downtrend may be reversing for gold. I am interested in GLD because a falling flag may be forming over the last seven days and this is a short-term bullish setup. A close above 112.75 would break flag resistance reverse this short-term slide.
****************************************
Thanks for tuning in and have a good day!
--Arthur Hill CMT
Plan your Trade and Trade your Plan
****************************************

