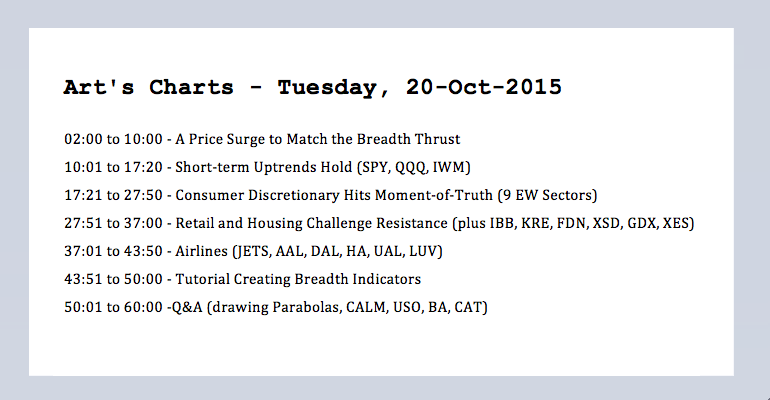
A Price Surge to Match the Breadth Thrust
It has been one heck of a three week period. SPY is up around 8%, QQQ is up around 9% and the Russell 2000 iShares (IWM) is up around 7.5%. There are, of course, two ways to interpret these price surges. Those wearing a bear hat will call it typical for a bear market rally (sharp) and point to overbought conditions. Those wearing a bull hat will point to strong buying pressure that signals an important low. So who's right?
In addition the price surge over the last three weeks, we saw a Zweig breadth thrust in early October and an upthrust in advancing volume. These charts were featured on Monday. The chart below shows prior times when the S&P 500 surged 8% or more with the green vertical lines. The blue arrows show rather deep pullbacks after the price thrusts in 2010 and 2011. Notice that the pullback in 2011 occurred after the breakout. There may indeed be a pullback after this price surge, but I view it as bullish right now and have yet to see enough contrary evidence to negate it.
Short-term Uptrends Hold (QQQ, SPY, IWM)
The short-term trends remain up for QQQ, SPY and IWM. Notice that the short-term PPOs have been above their signal lines for over two weeks now. There can be no short-term trend reversal as long as short-term momentum is bullish. A signal line cross would signal a downturn in momentum, but I would not turn short-term bearish on the stock market just yet. I am looking for three things before turning short-term bearish again. SPY needs to close below support at 198, QQQ needs to close below support at 105.5 and the PPO for IWM needs to turn negative. The short-term uptrend rules until these three signals trigger.
Consumer Discretionary Hits Make-or-Break Area
The Equal-Weight Consumer Discretionary ETF (RCD) remains stuck in a trading range after the August breakdown and there are three trends active on this chart. A long-term downtrend took hold after the August breakdown. The medium-term trend is flat with the range from late August to mid October. The short-term trend is up with the surge from late September to early October. Notice that the PPOs confirm these three trends. The black PPO (20,120,1) is negative, the pink PPO (10,60,1) is near the zero line and the short-term PPO (5,30,1) is positive. RCD is hitting resistance near 89 and this is the first level to watch for a significant breakout. Barring an upside breakout, watch support at 86.8 for a break to reverse the short-term uptrend. This could be very significant because the long-term downtrend may provide a tailwind.

Retail and Housing Challenge Resistance
As noted in my ChartWatchers post this weekend, the EW Consumer Discretionary ETF (RCD) was lagging the Consumer Discretionary SPDR (XLY) and this was a concern for two reasons. First, RCD represents the "average" stock in the consumer discretionary sector. Second, the consumer discretionary is the most economically sensitive sector and can be a leading indicator for the stock market as a whole.
Within the consumer discretionary, I am focused on the Retail SPDR (XRT) and the Home Construction iShares (ITB) for clues as well. XRT gapped up with the rest of the market on October 5th and this gap is holding. Even though the ETF remains below its mid September high and shows some relative weakness, the ability to hold the gap is positive and a follow through breakout at 46.50 could foreshadow an upturn in the bigger trend.
ITB is also showing relative weakness and remains in a downtrend since late August. The blue line marks the 200-day moving average and the ETF as crossed this level at least six times since late August. What a battle! I am watching the falling channel for clues of a bigger trend reversal. Look for a close above 28 for a breakout here. I am also watching the PPOs because it would not take much to moved them back into positive territory and revive the bigger uptrend.
Stocktoberfest Highlights
Stocktoberfest is currently happening in Coronado, California. I was not able to attend, but I was able to watch some presentations on Periscope TV, which is a part of Twitter. These have since expired, but I have included a few quotes from the ChartArt panel. In particular, I think Charlie Bilello CMT gave a great presentation. Note that I am paraphrasing here.
- JC Parets: Overhead supply in S&P 500 needs to be absorbed because we now have the "just please get me out at breakeven crowd" coming into to sell near broken support.
- Brian Shannon: The key to price action can be found in the four stages of price movement: accumulation, markup, distribution and decline (via Stan Weinstein).
- Charlie Bilello: The 6-year annualized return from 2009 to 2015 had not seen since the 2000 peak and 1987 peak. Expect lower returns over the next few years.
- Charlie Bilello: US equities have been dominant over the last five years. Don't ignore opportunities abroad because of a "recency bias".
- Charlie Bilello: The worst thing you can do in markets is panic. You have to have a plan and you have to execute that plan.
- Ryan Detrick: There is a lot of fear out there and we are less than 5% from an all time high
- Ryan Detrick: IBB was up for a record 10 consecutive quarters and then plunged. Historical returns after the biggest drops in IBB are really good.
- Chris Kimble: What goes up in a down market? Correlation!
****************************************
Thanks for tuning in and have a good day!
--Arthur Hill CMT
Plan your Trade and Trade your Plan
****************************************


