Between a Setup and a Signal
Note that I will post a video around 10AM ET. Trends are the driving force, signals are the exception and no-man's land is the norm. What the heck does that mean? First, the bigger trend is the driving force in my trading strategy. I look for bullish setups when the bigger trend is up and bearish setups when the bigger trend is down. The bigger trend is down right now so I am looking for bearish setups (or staying out). Don't forget that playing the down side of the market is much harder and riskier than playing the upside. Bear market rallies can be very sharp and profits can disappear quickly. This is why cash really is an option when the bigger trend is down. Moving to cash helps avoid big drawdowns, reduces risk and boosts relative performance.
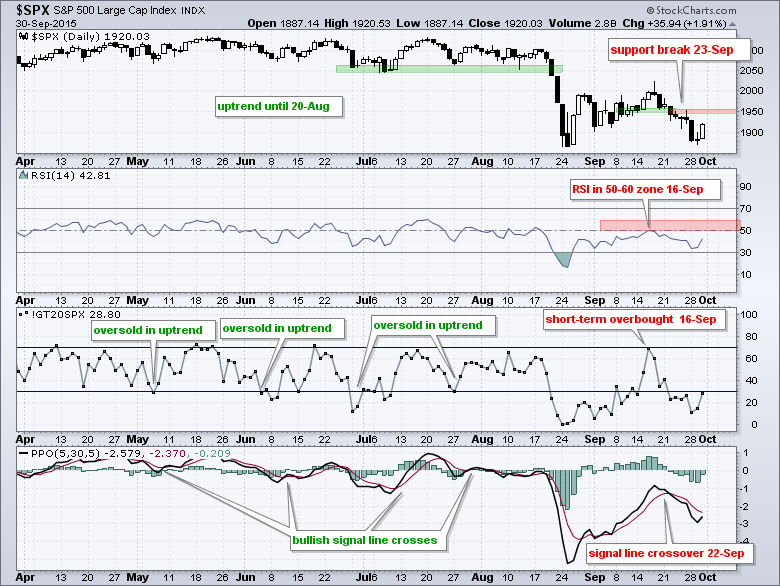
So we are currently in a downtrend overall and this means bearish signals take priority over bullish signals. The next thing to keep in mind is that signals are the exception, not the norm. Unless you are day trading, we will not get bearish signals every week. A bearish signal triggers after a setup, which is when the major index ETFs become short-term overbought or bounce. The setup occurred in mid September when short-term breadth indicators (%Above 20-day EMA) became overbought and RSI moved into the 50-60 zone on 16-Sep. These setups were followed by a bearish signal line cross in the PPO on 22-Sep and a support break in SPY on 23-Sep.
We are now in no-man's land and this is where the market spends most of its time (in between setups and signals). This is the main reason I wanted to get out of the daily grind with intraday charts and focus on signals with some shelf life. The bearish signals triggered a week ago, the S&P 500 firmed at the August low on Tuesday and bounced on Wednesday with a 1.91% gain. If anything, this is a spot for bottom pickers, but I am not a bottom picker and prefer to adhere to the bigger trend, which remains down. Broken support is the first level to watch for the S&P 500 because a move back above 1955 would negate last week's bearish signal. It would not, however, be enough to reverse the bigger downtrend.
QQQ-SPY-IWM Remain on Signal
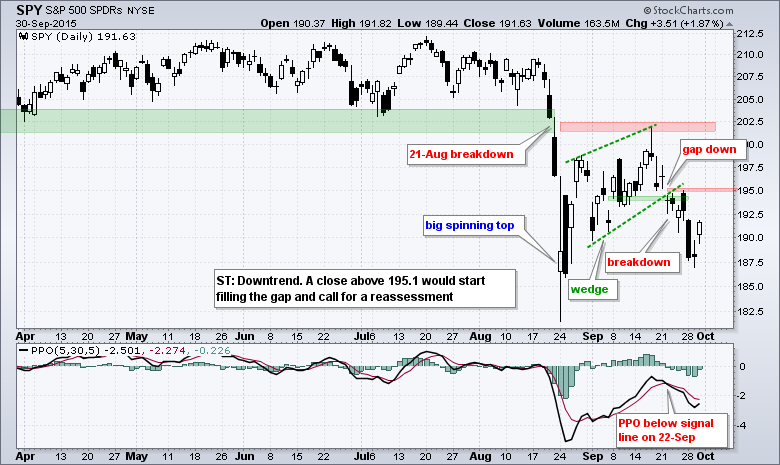
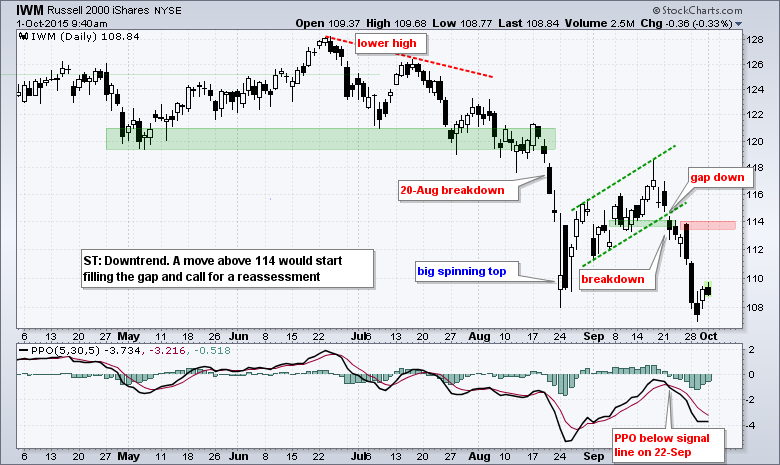
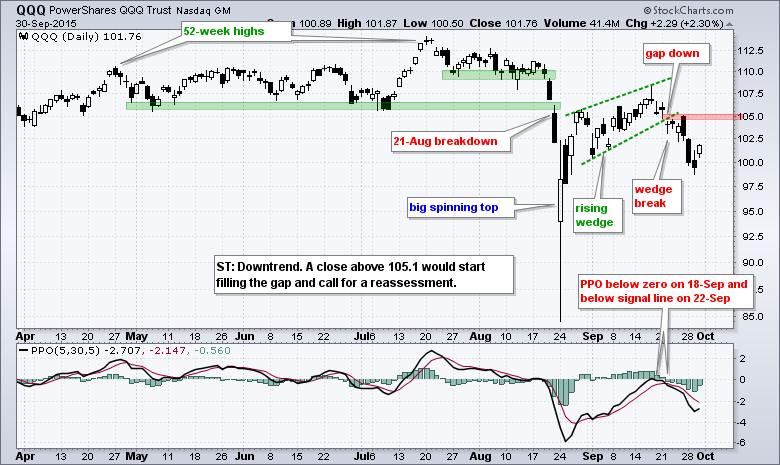
QQQ, SPY and IWM triggered bearish signals last week with down gaps, PPO crosses and wedge breaks, and these signals remain valid. The bigger trends are down, the setups are past us and the signals have triggered. This means we are in no-man's land. The highs from last Friday now mark the first level to watch for signal negation. If you will recall, stocks opened sharply higher last Friday and then closed weak to form long black candlesticks. A move above Friday's highs would start filling the 22-Sep gaps and negate last week's bearish signals.
Seven of Nine Sector SPDRs in ST Downtrends
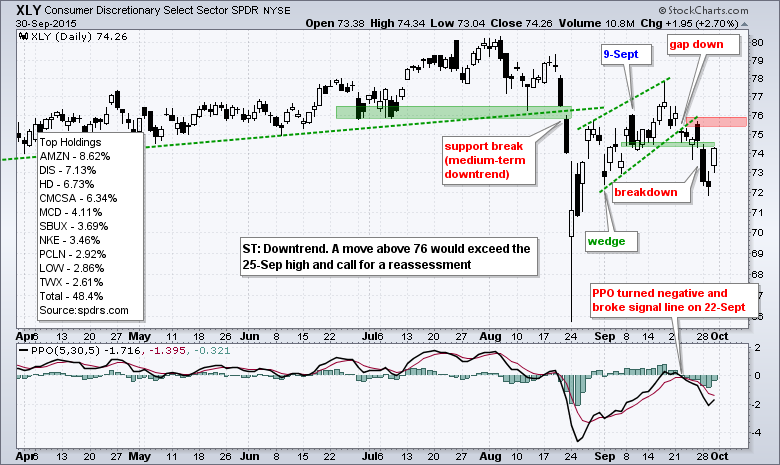
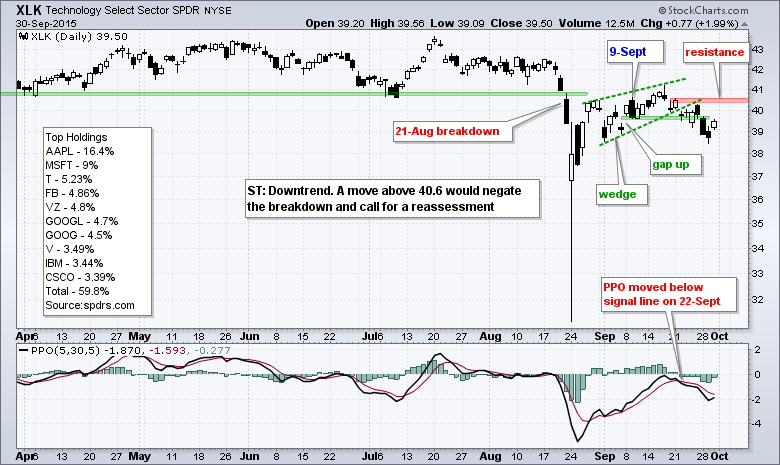
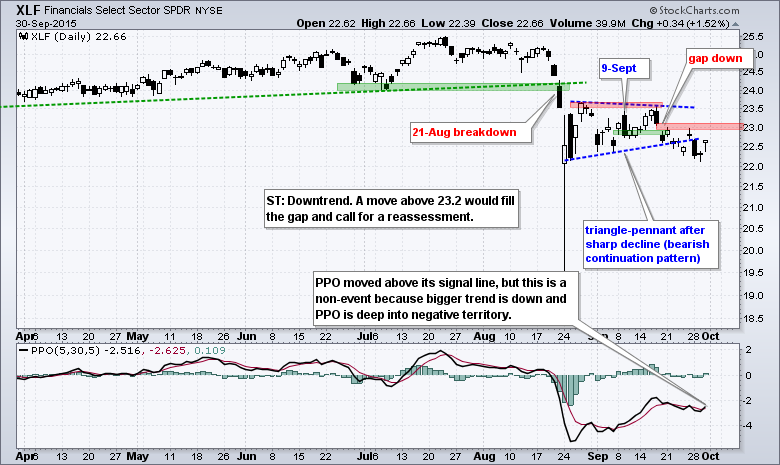
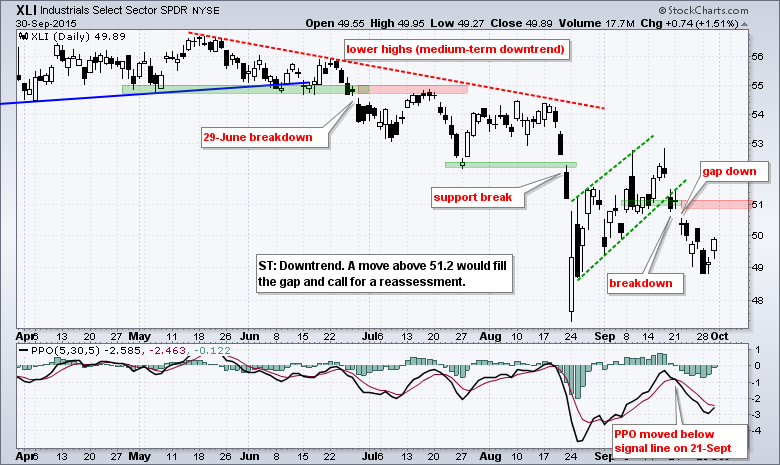
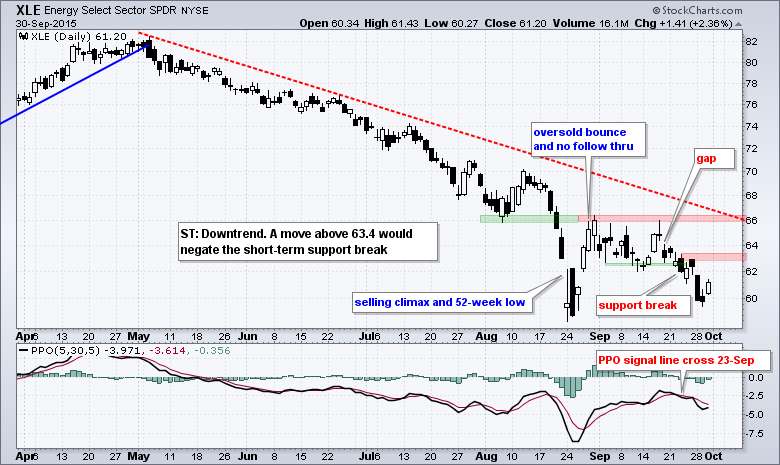
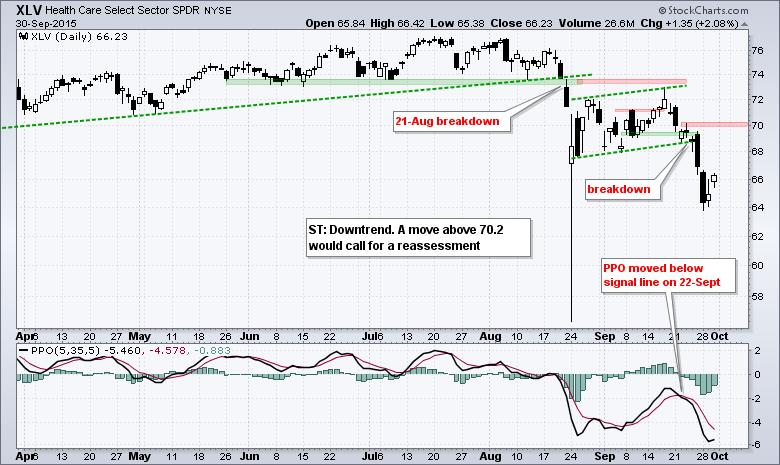
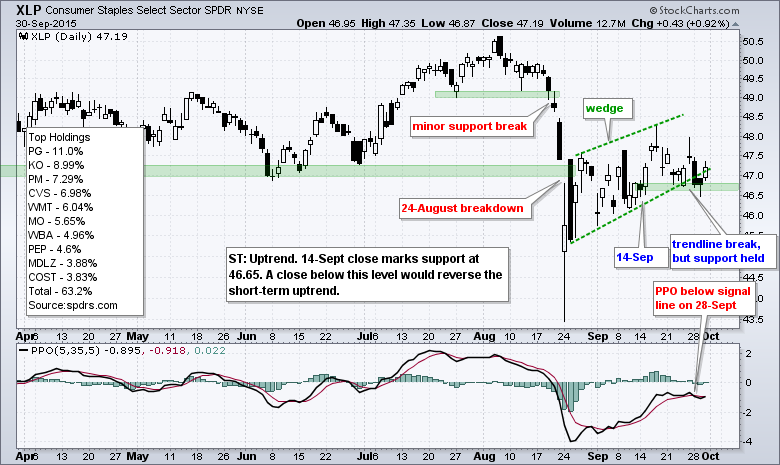
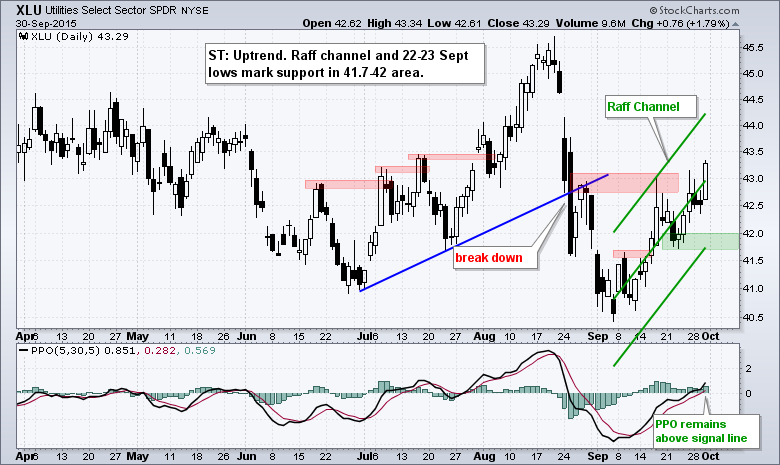
Utilities and consumer staples are the only two sectors still in short-term uptrends and this confirms the risk-off nature within the stock market right now. The four offensive sectors remain in short-term downtrends. The Industrials SPDR (XLI) and Finance SPDR (XLF) broke down first with signals on September 18th. The Technology SPDR (XLK) and Consumer Discretionary SPDR (XLY) followed suit with signals last week. Note that all four are in medium-term downtrends since the August breakdowns. The red zones mark the levels I am watching and a close above these levels would argue for a reassessment of the short-term trend reversals.
Materials and Energy Continue to Lag
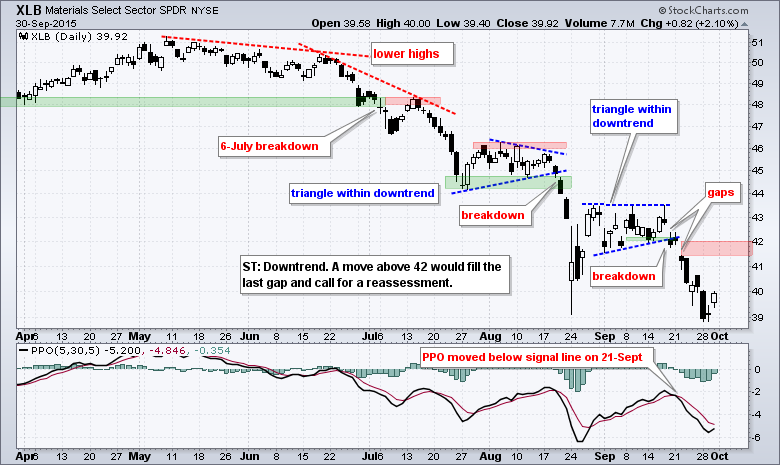
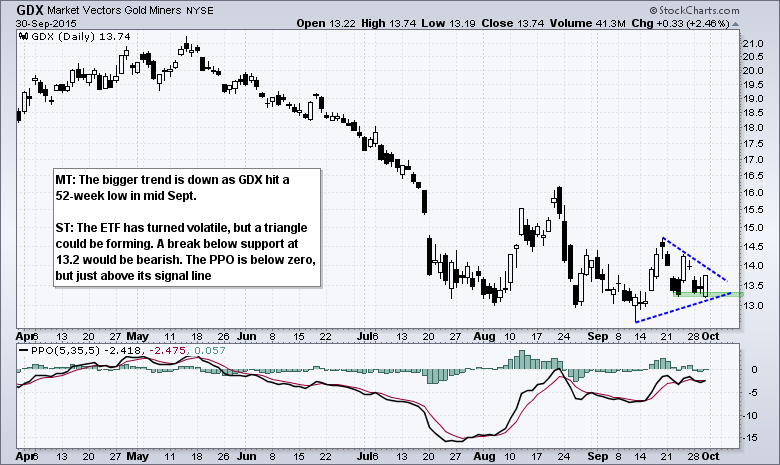
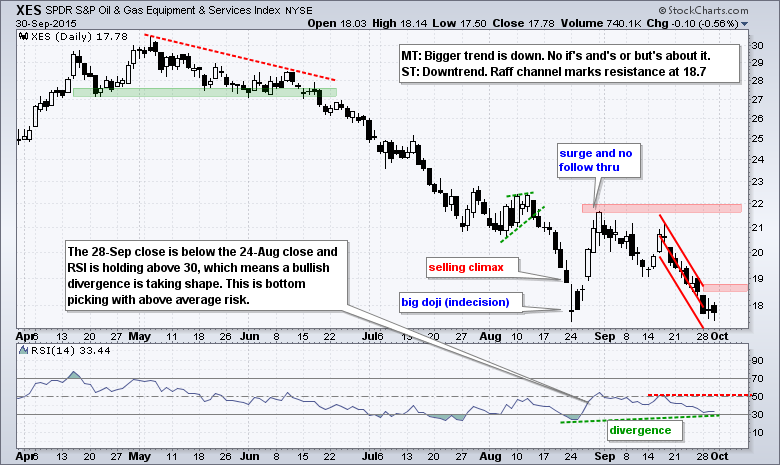
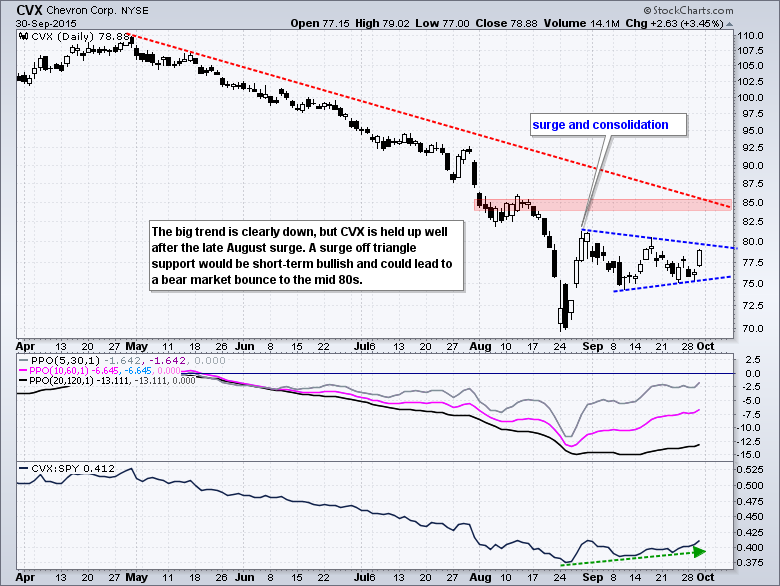
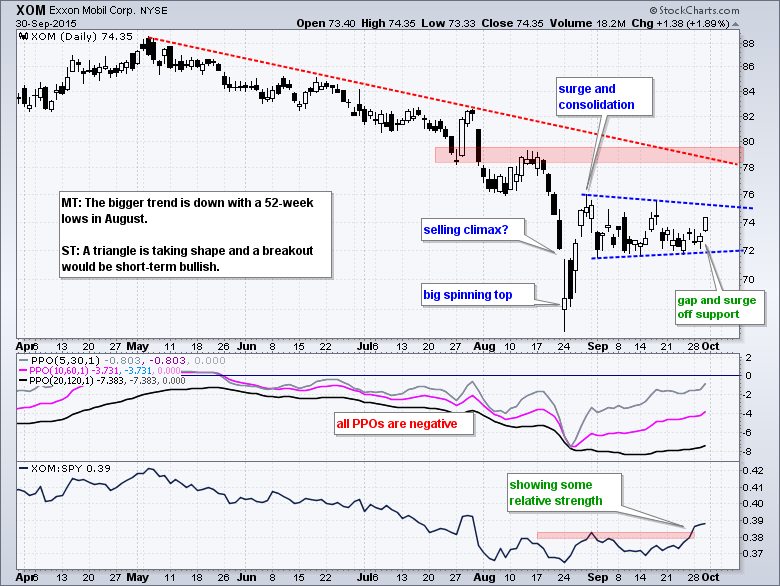
The Energy SPDR (XLE) and Materials SPDR (XLB) remain the weakest of the nine sector SPDRs overall. XLB hit a new low in September and XLE is close to a new low. Nevertheless, the pennants taking shape in oil, Chevron and ExxonMobil intrigue me. These are covered in the last section.
Consumer Staples and Utilities Lead
The Consumer Staples SPDR (XLP) and the Utilities SPDR (XLU) remain the strongest of the nine sector SPDRs in September. In fact, they are the only two with gains this past month. The HealthCare SPDR (XLV) broke short-term support last week and this break remains valid.
Seven Industry Group ETFs
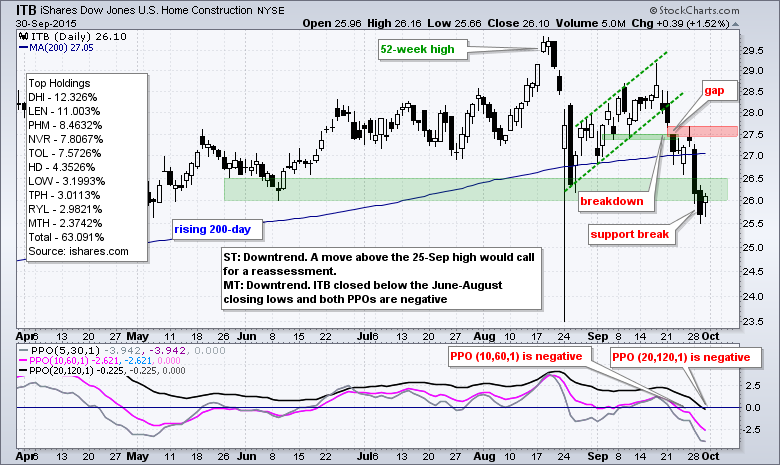
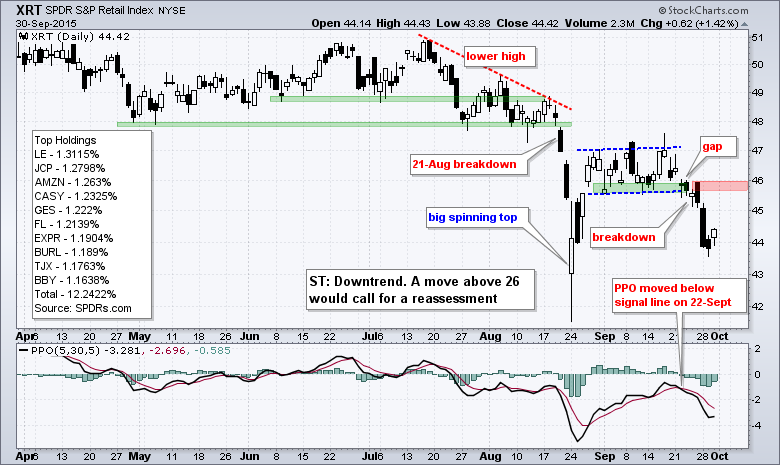
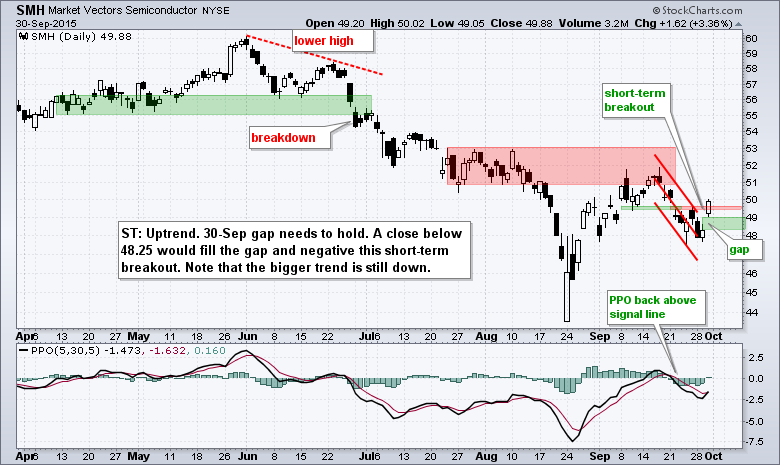
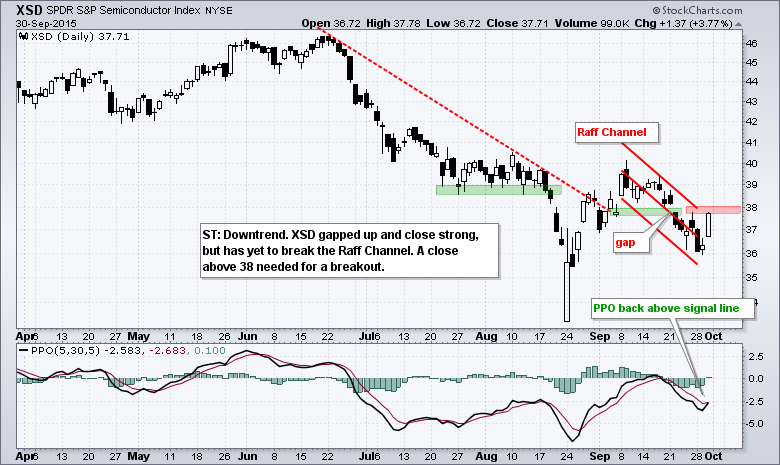
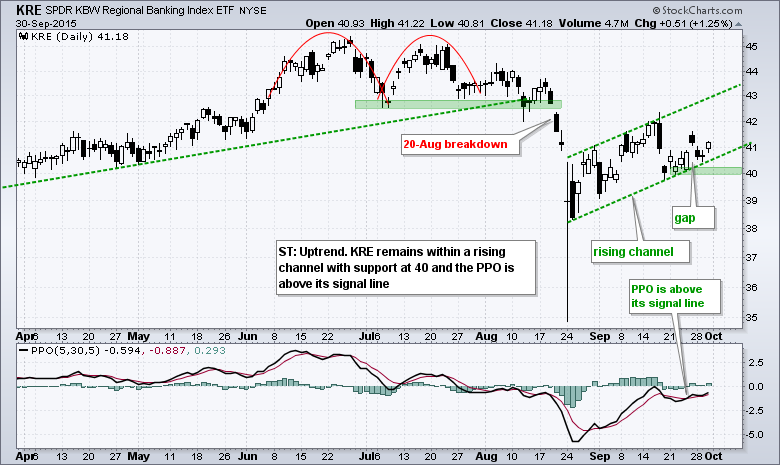
This section highlights interesting patterns in some industry group ETFs. Of note, the Home Construction iShares (ITB) broke down this week and the bigger trend is now down. The semiconductor ETFs are split because SMH got a short-term breakout, but XSD did not confirm. Note that INTC and TXN account for 23% of SMH. In contrast, XSD is an equal-weight ETF with 46 semiconductor stocks and this makes XSD more representative of the industry group as a whole. Regional banks are performing well in September, but the bigger trend is still down and I am watching support closely.
Oil, Chevron and Exxon Extend Consolidations
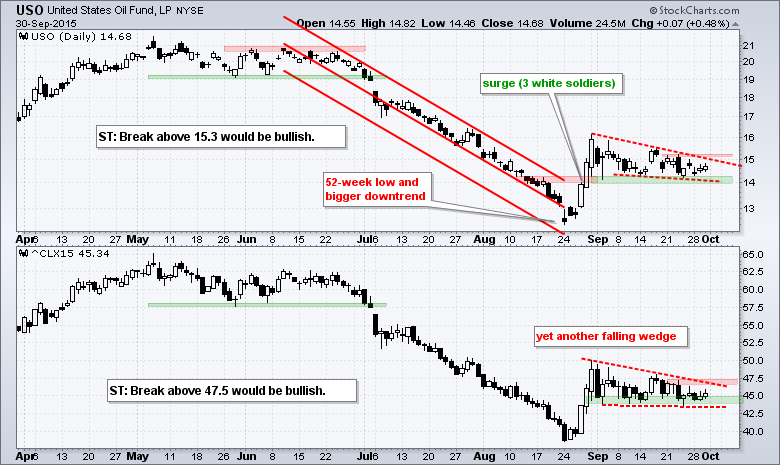
There is no real change in oil as the USO Oil Fund (USO) and December Crude Futures (^CLX15) remain stuck in falling wedge patterns. The green zones mark support around 14 for USO and support around 44 for December Crude. Note that these zones also mark a 50-62% retracement of the late August surge. If oil is indeed going to hold, this is the place. A break below 14 in USO and 44 in crude would be bearish. As long as this short-term support holds, I am watching for a wedge breakout that could trigger a continuation of the late August surge. Watch 15.3 on USO and 47.5 on December Crude. Needless to say, a breakout in oil would lift XES, XLE, CVX and XOM.

*****************************************
Thanks for tuning in and have a good day!
--Arthur Hill CMT
Plan your Trade and Trade your Plan
*****************************************

