What do VIX Extremes Tell Us?
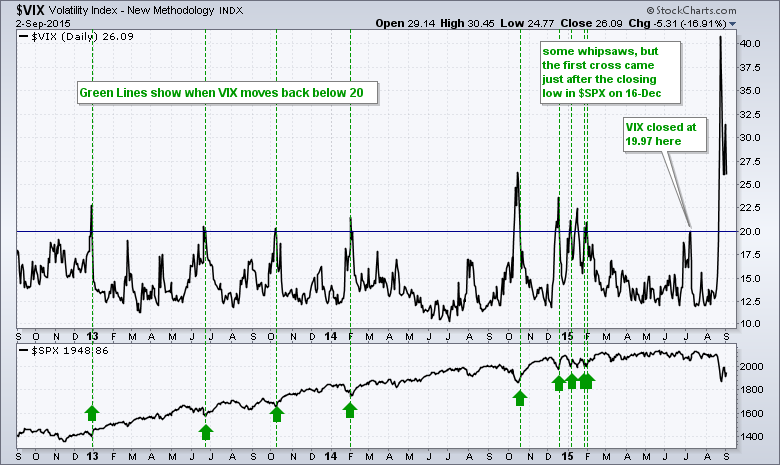
Even though it can be difficult to trade based on extremes, note that the volatility indices are at extremes that suggest plenty of fear and this could foreshadow a bounce. The first chart shows daily closing values for the S&P 500 Volatility Index ($VIX) in the main window and the S&P 500 in the indicator window. I added a horizontal line at 20 to define the recent extremes. A surge above 20 suggests excessive fear in the stock market and this can give way to a bounce. Sometimes the market can become fearful and remain fearful, which means the downtrend is continuing in the S&P 500 and the VIX is remaining at relatively high levels. This is why chartists should wait for a sign that fear is subsiding. A subsequent move below 20 indicates that fear is indeed subsiding and buyers are returning to the stock market. The green lines mark subsequent moves below 20 over the last two years.
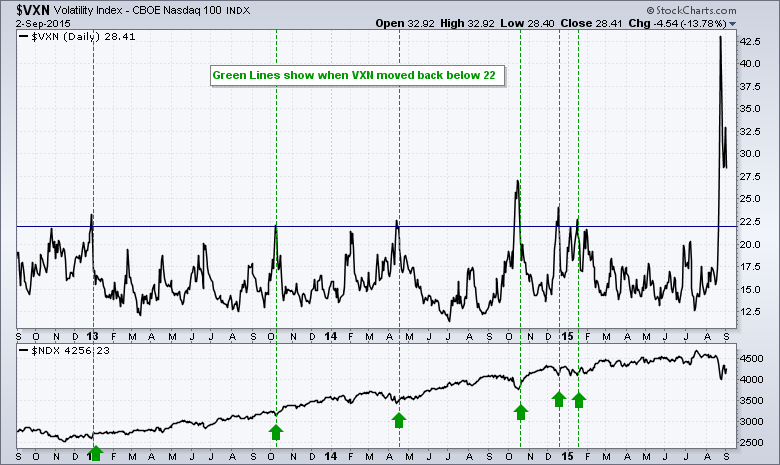
The second chart shows the Nasdaq 100 Volatility Index ($VXN) and the Nasdaq 100. I set the key level at 22 for $VXN because the Nasdaq 100 is a little more volatile than the S&P 500. Fear remains high on the Nasdaq 100 because $VXN is near 28 and has yet to come down.
Large-cap Techs are Holding Up Well
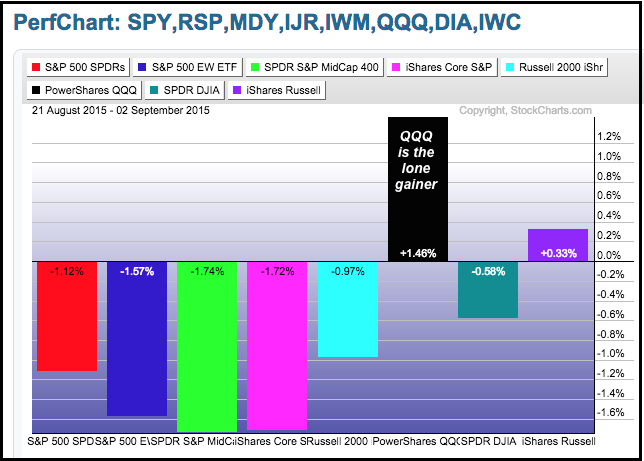
The PerfChart below shows the 8-day Rate-of-Change for eight major index ETFs. Six are down and two are up. QQQ and the Micro-cap iShares (IWC) are showing both relative and absolute strength. This suggests that big techs and micro-caps may lead any rebound in the broader market.
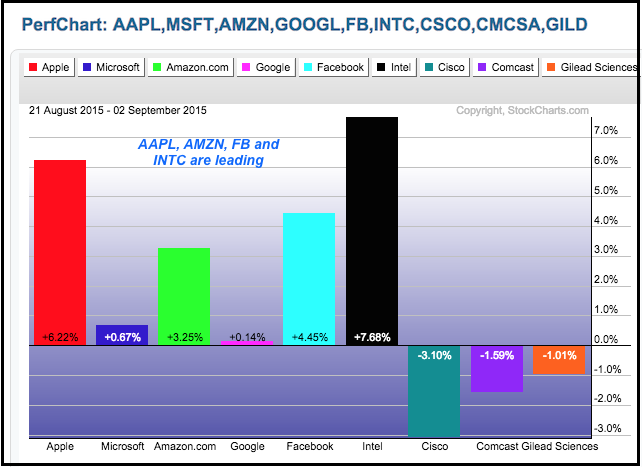
The second PerfChart shows the 8-day Rate-of-Change for the top ten stocks in QQQ. Notice that seven are up and three are down. Apple, Amazon, Facebook and Intel are leading with gains exceeding 3%. Cisco, Comcast and Gilead are lagging with small losses.
QQQ Shows Resilience after Break Down
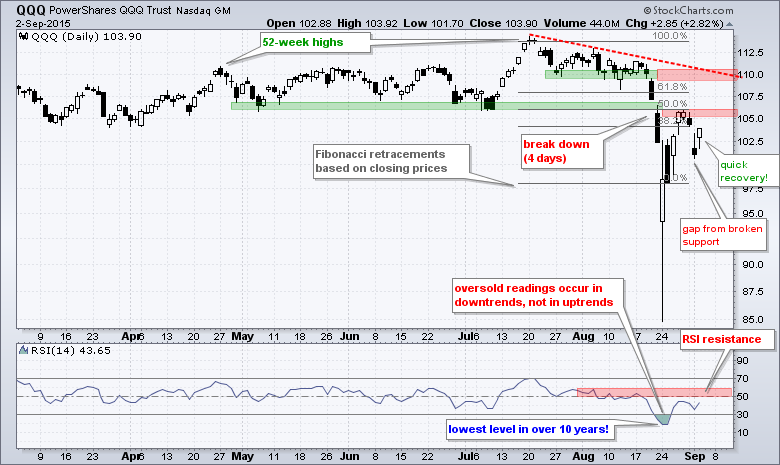
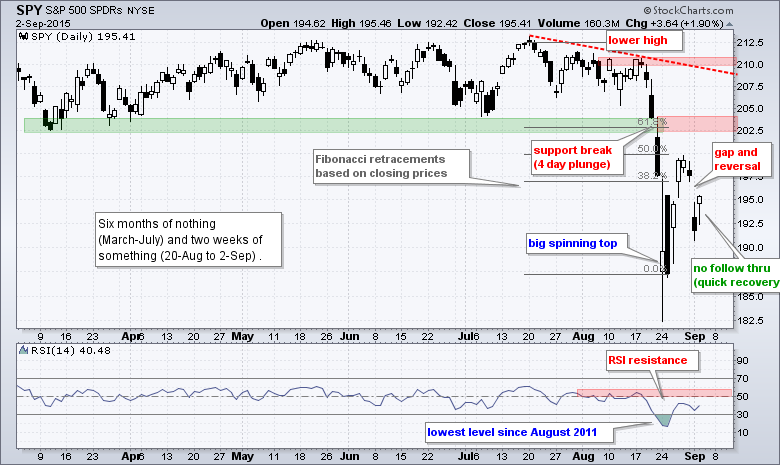
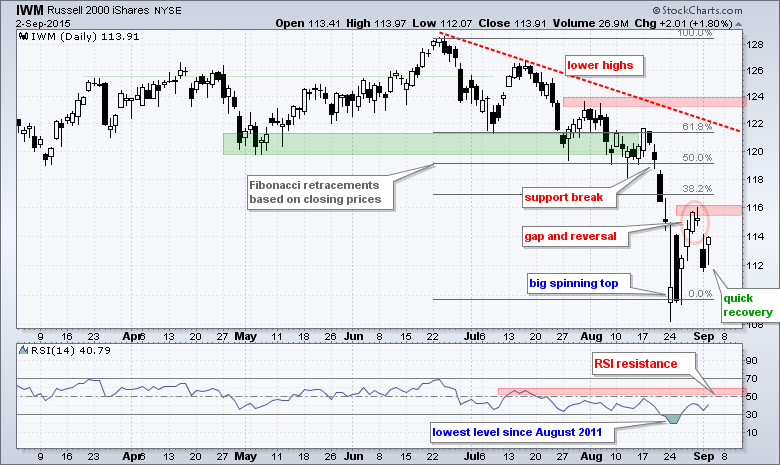
The overall trends remain down for QQQ, SPY and IWM, but stocks are showing resilience after a quick recovery on Wednesday. Note that green annotations are bullish, red annotations are bearish and blue annotations are neutral (just pointing something out). Turning back to the QQQ chart, the overall trend change is based on four down days in mid August. The first two broke support, the third formed a huge spinning top and the fourth closed slightly lower (long black candlestick). I would certainly be impressed if QQQ breaks back above 106 to negate the support break. Notice that the ETF closed strong on Wednesday and it would not take much follow through to trigger a breakout.
Retail, Semis and Biotechs Lead Industry Group ETFs
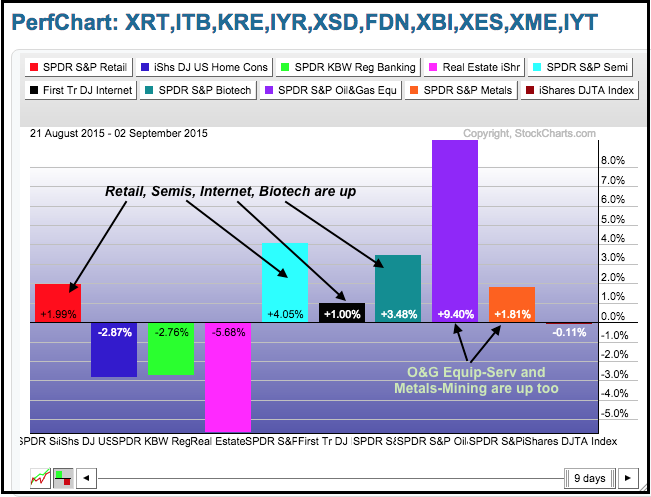
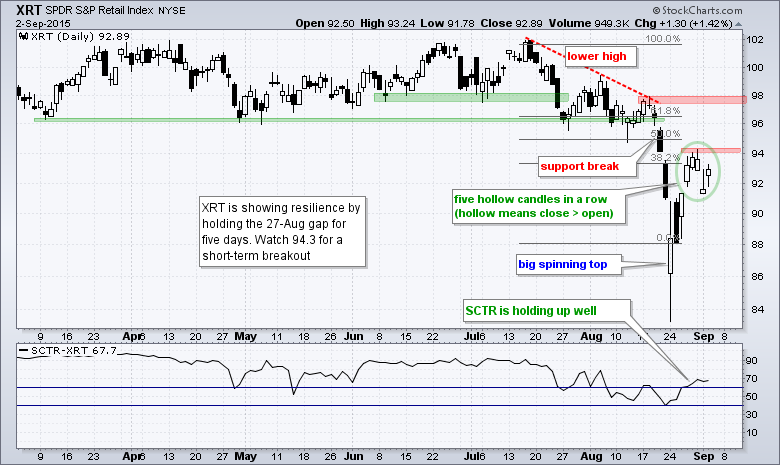
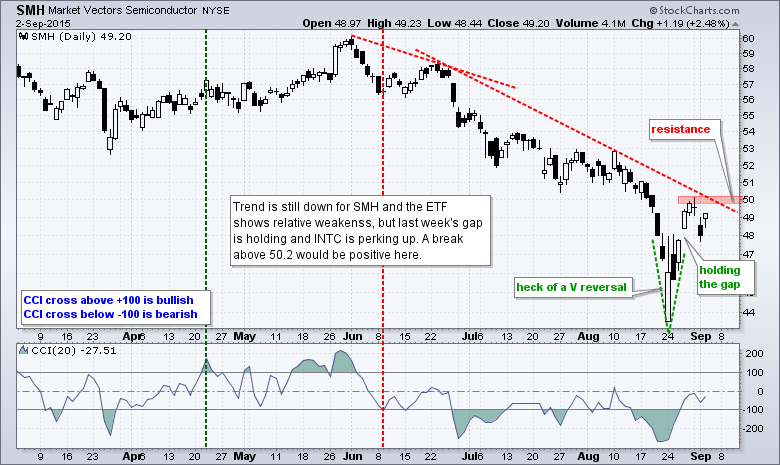
The PerfChart below shows the 8-day Rate-of-Change for ten key industry group ETFs. For reference, remember that QQQ and IWC were the only major index ETFs to show gains over this period. SPY, DIA and IWM are down over the last eight trading days. This means the Retail SPDR (XRT), Semiconductor SPDR (XSD) and Biotech SPDR (XBI) are showing relative strength with gain. The Internet ETF (FDN) is also up. I am ignoring the Oil & Gas Equip & Services SPDR (XES) and Metals & Mining SPDR (XME) because these two are by far the weakest overall.
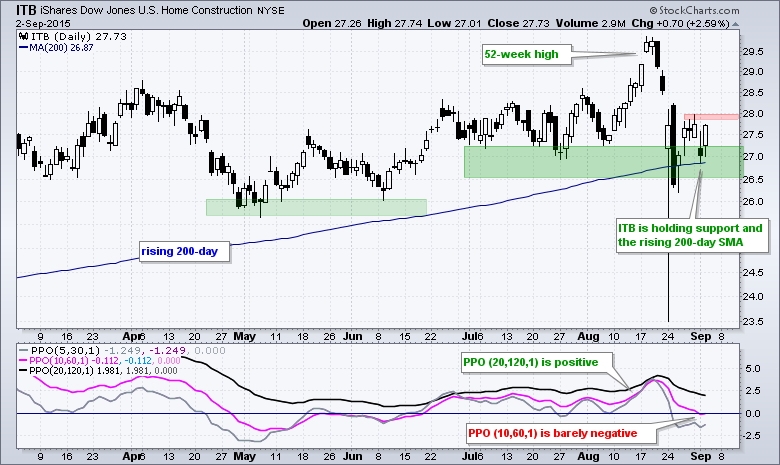
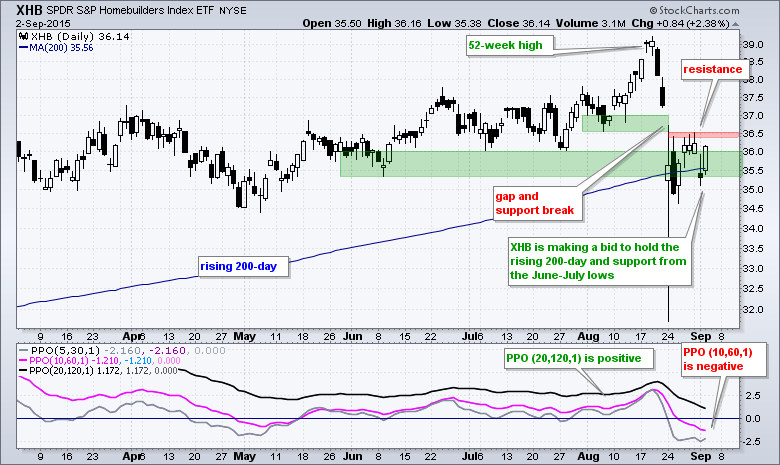
ITB Holds Uptrend and SMH Perks Up
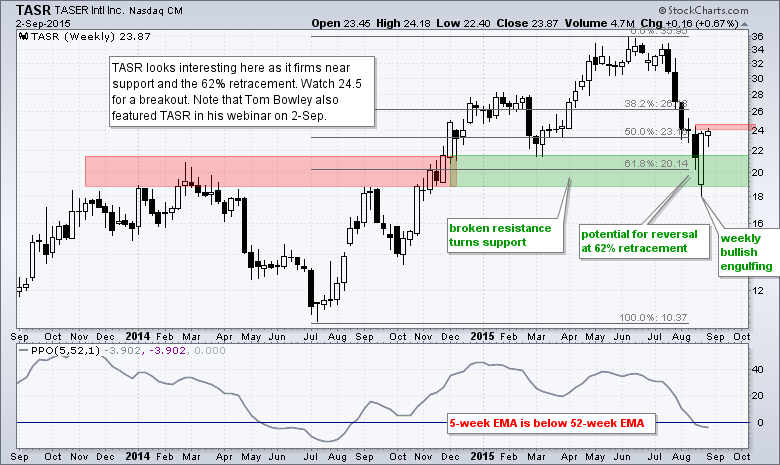
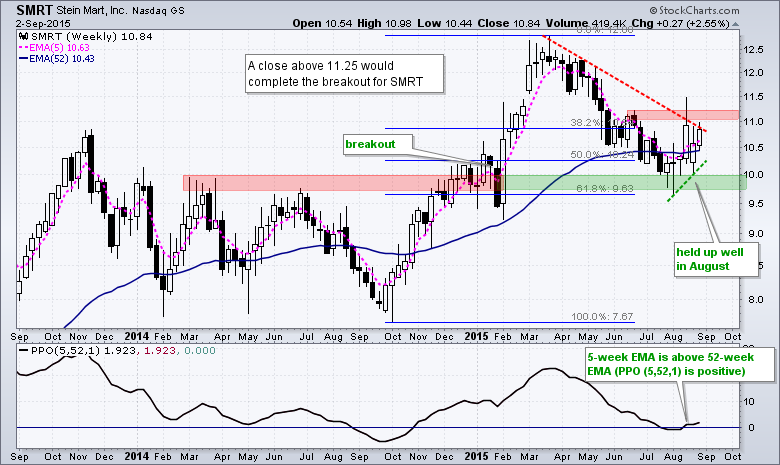
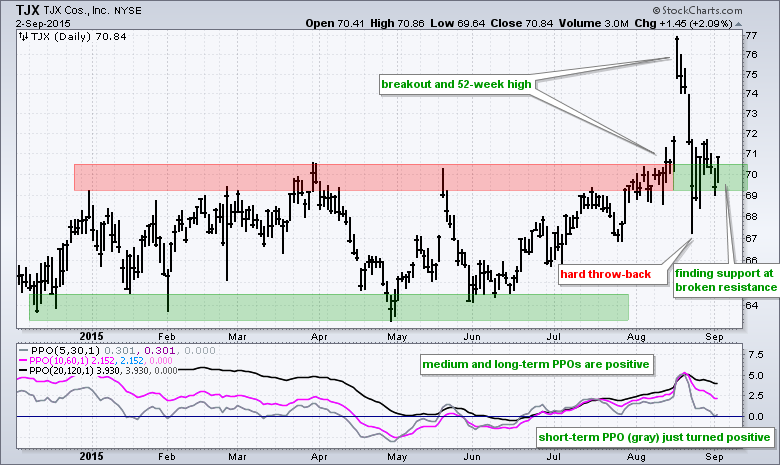
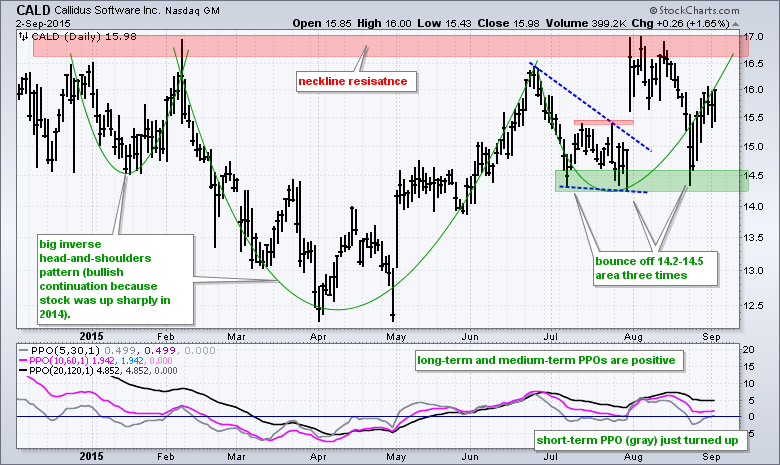
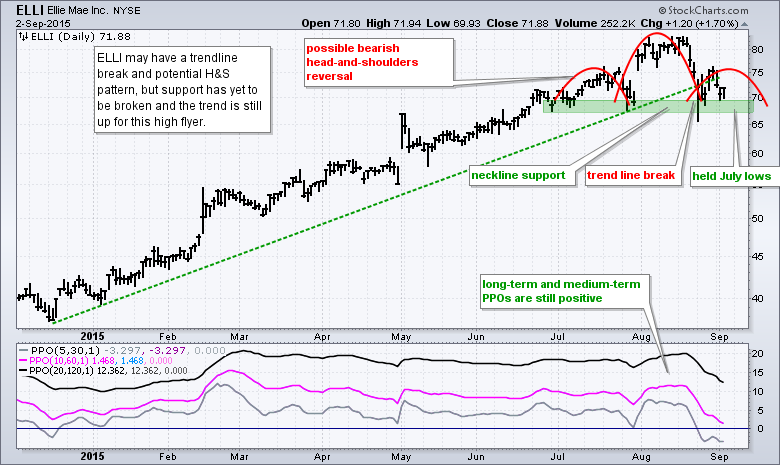
Stocks to Watch (TASR, SMRT, TJX, CALD, ELLI)
Video will cover ULTI, AKS, NUE, STLD, PANW and PFPT.
**********************************************
Plan your Trade and Trade your Plan!
--Arthur Hill CMT

