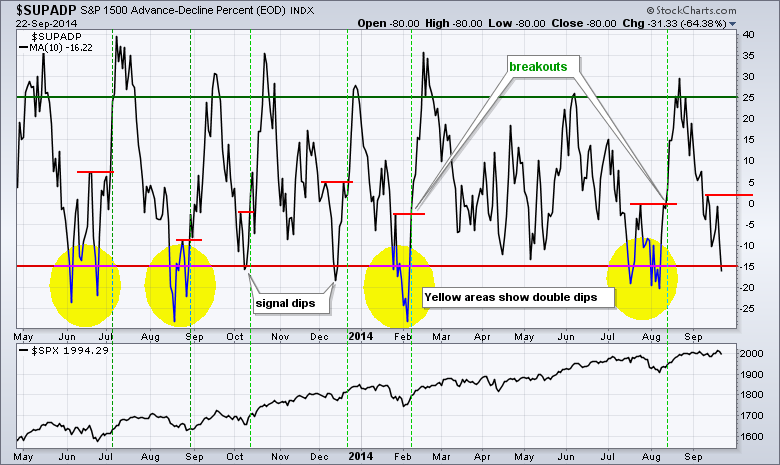
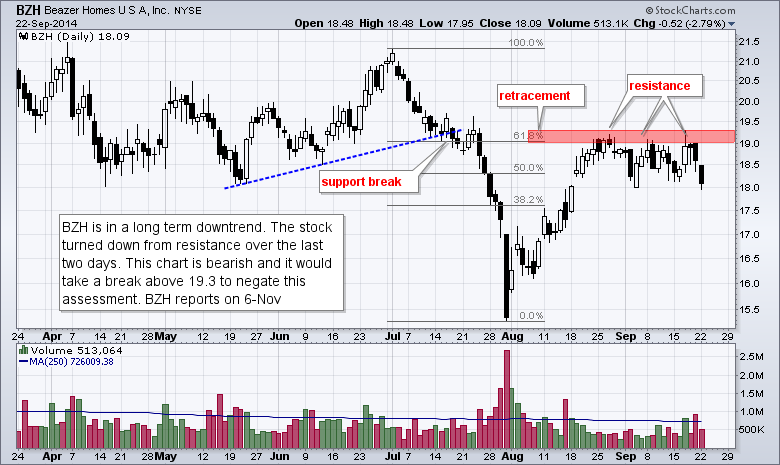
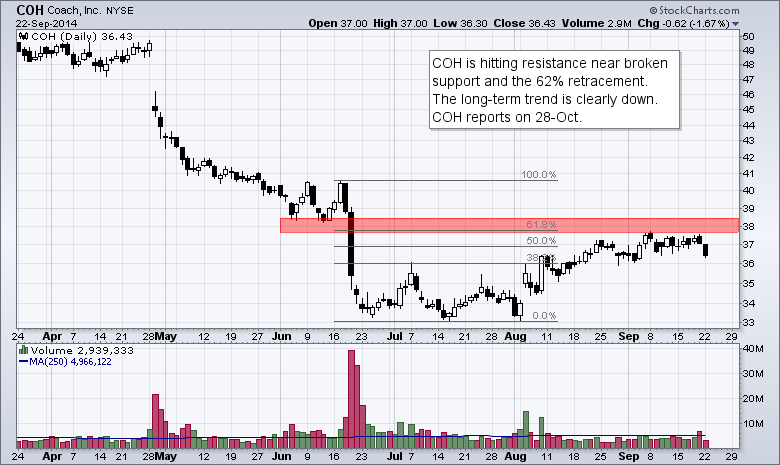
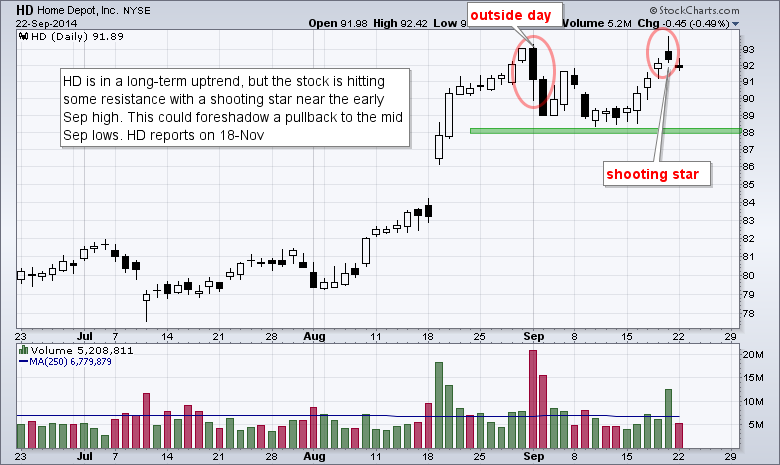
Stocks were hit with selling pressure on Monday with small-caps leading the way lower. Small-caps have been weak all month and simply continued this trend on Monday. All sector SPDRs were down with the consumer staples holding up the best. The consumer discretionary and energy sectors were hit hard. Weakness in housing and retail weighed on the consumer discretionary sector. Weakness in oil weighed on the energy sector. Momentum names and metal-related stocks were also hit hard. The September sell has been enough to push the 10-day moving average of AD Percent for the S&P 1500 below -15% for the first time since early August. A move below -15% creates a short-term oversold condition. As the chart below shows, there were four double-dip and two-signal dip signals. A bull signal occurs when the indicator turns up and breaks a prior peak (red lines). I am going to mark the key peak at +2%. A break above this level would put short-term breadth back on the bullish footing.
**This chart analysis is for educational purposes only, and should not
be construed as a recommendation to buy, sell or sell-short said securities**
**************************************************************
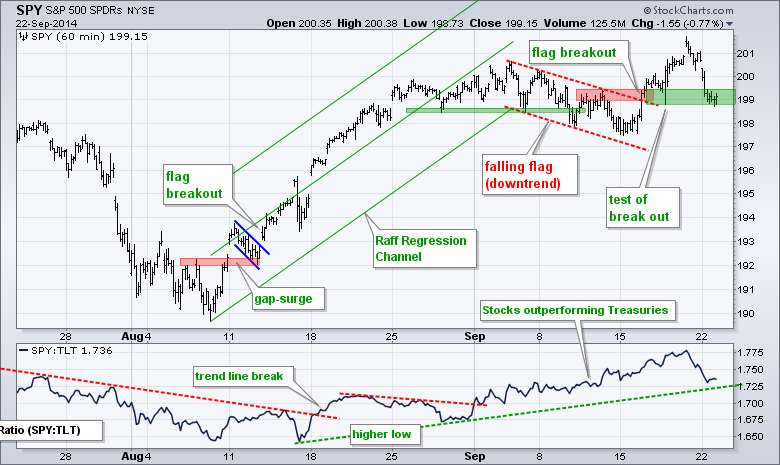
SPY broke flag resistance last week and pulled back to the breakout zone over the last two days. Broken resistance and the Wednesday's low mark key support in the 199 area. Further weakness below 198.8 would negate this breakout.
**************************************************************
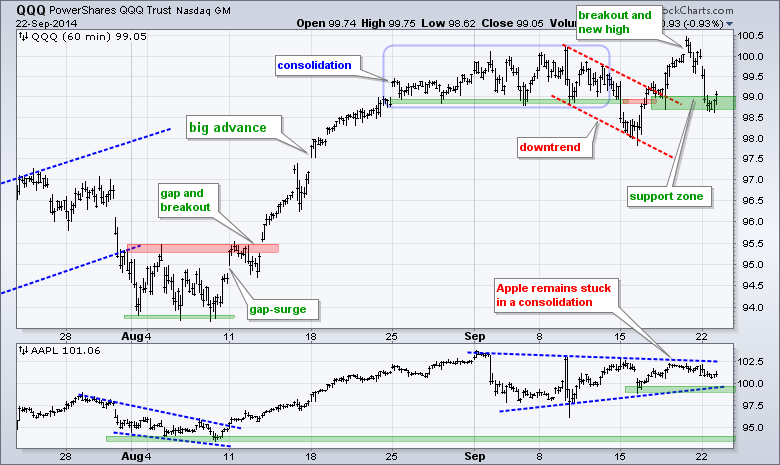
QQQ broke out last week and returned to the breakout zone this week. The ETF firmed in the afternoon and even managed to close above 99. A break below yesterday's low would negate last week's flag breakout and be short-term bearish. Apple remains in a consolidation and the direction of its break will influence QQQ.
**************************************************************
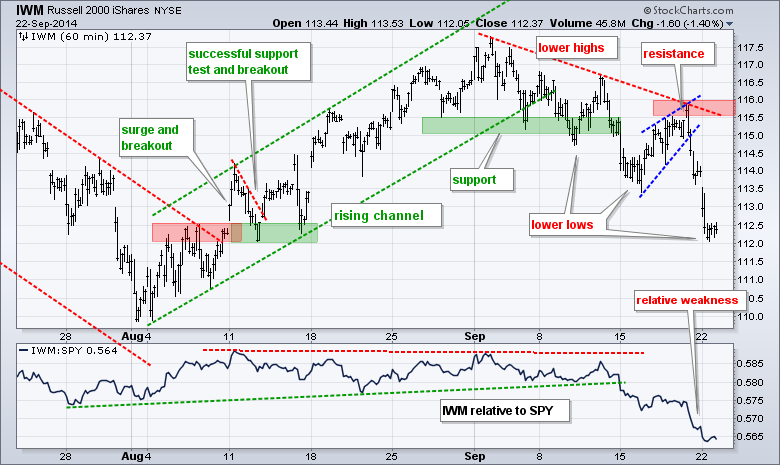
IWM broke support in mid September, formed a lower high last week and plunged over the last two days. Nothing but lower lows and lower highs this month (downtrend). The ETF did managed to firm after the first two hours and is short-term oversold, but the trend is down and the ETF shows relative weakness, which is a negative combination overall.
**************************************************************
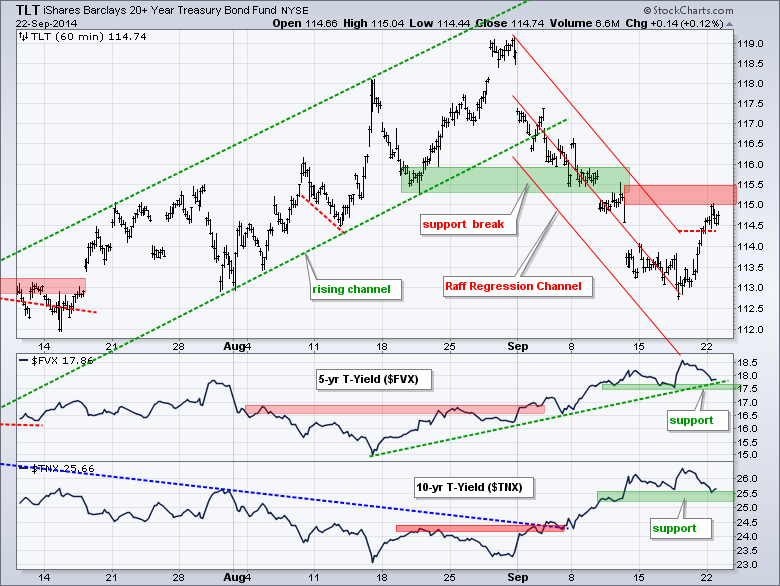
No change. The 20+ YR T-Bond ETF (TLT) got an oversold bounce with a surge above the upper trend line of the Raff Regression Channel. It is tempting to call this a bullish reversal (breakout), but the 10-YR Treasury Yield ($TNX) and the 5-year Treasury Yield ($FVX) remain above support. I would turn bullish on Treasuries if both yields broke support. TLT resistance is set at 115.50 for now. Remember, Treasury yields and prices move in opposite directions and yield analysis is a backstop for price analysis.
**************************************************************
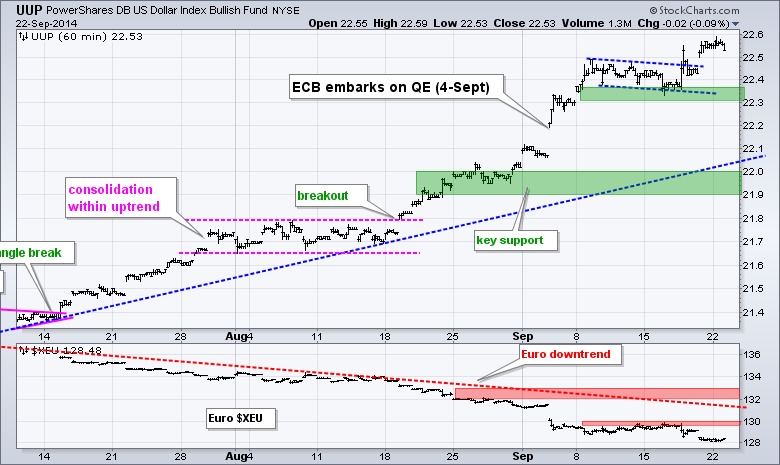
NO change. UUP consolidated in mid September and then broke out (twice). The consolidation lows mark first support in the 22.30-22.40 area. While a move below this level would break support, I would not turn bearish because the bigger trend is still up - and the Euro is in a strong downtrend. Key support for UUP remains at 21.9 for now.
**************************************************************
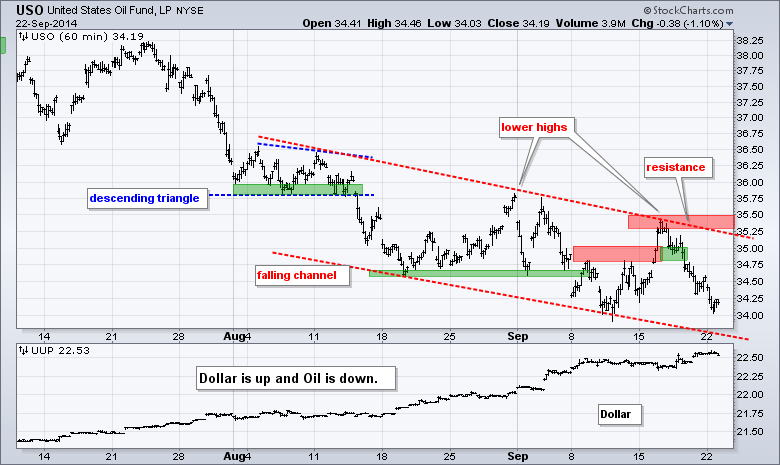
No change. The USO Oil Fund (USO) broke support and then moved right back above this break with a surge on Tuesday. The recovered support break did not last long as the ETF fell back below 34.7 on Thursday. This bounce was considered an oversold bounce within a downtrend. With the reaction high, I can now mark key resistance at 35.5
**************************************************************
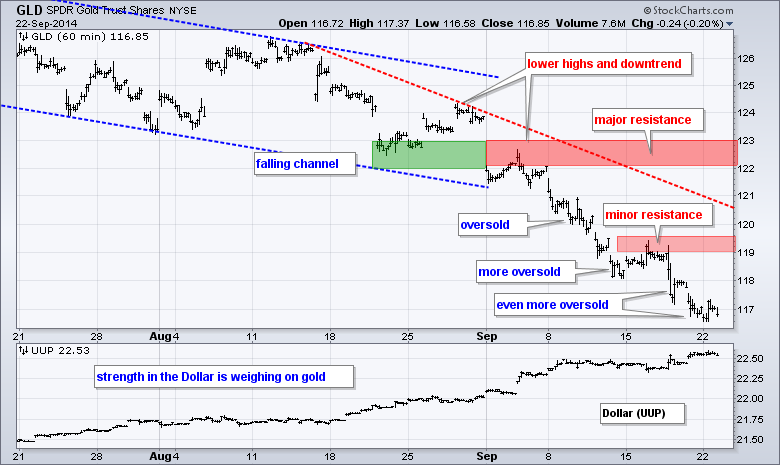
No change. Gold is a classic case of becoming oversold and remaining oversold. With the recent highs around 119-119.5, I will move minor resistance to this area. A breakout here could give way to an oversold bounce. Chartists should also watch the Dollar because gold is clearly tied to the Dollar. Broken support and the early September high mark major resistance in the 122-123 area.
***************************************************************
Key Reports and Events (all times Eastern):
Tue - Sep 23 - 09:00 - FHFA Housing Price
Wed - Sep 24 - 07:00 - MBA Mortgage Index
Wed - Sep 24 - 10:00 - New Home Sales
Wed - Sep 24 - 10:30 - Crude Oil Inventories
Thu - Sep 25 - 08:30 - Initial Jobless Claims
Thu - Sep 25 - 08:30 - Durable Goods Orders
Thu - Sep 25 - 10:30 - Natural Gas Inventories
Fri - Sep 26 - 08:30 - GDP
Fri - Sep 26 - 09:55 - Michigan Sentiment
Chart Setups on Tuesday and Thursday.
This commentary and charts-of-interest are designed to stimulate thinking. This analysis is not a recommendation to buy, sell, hold or sell short any security (stock ETF or otherwise). We all need to think for ourselves when it comes to trading our own accounts. First, it is the only way to really learn. Second, we are the only ones responsible for our decisions. Think of these charts as food for further analysis. Before making a trade, it is important to have a plan. Plan the trade and trade the plan. Among other things, this includes setting a trigger level, a target area and a stop-loss level. It is also important to plan for three possible price movements: advance, decline or sideways. Have a plan for all three scenarios BEFORE making the trade. Consider possible holding times. And finally, look at overall market conditions and sector/industry performance.

