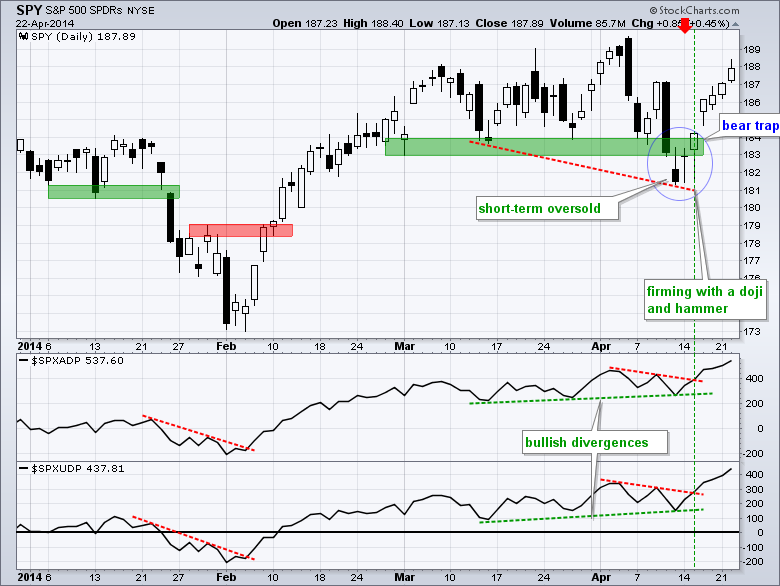
After becoming short-term oversold on 10-11 April, stocks firmed Monday-Tuesday last week and started a rally on Wednesday-Thursday. This short-term upswing continued this week with both QQQ and SPY advancing six days straight. On the breadth charts below, notice that the AD Line and AD Volume Line for the S&P 500 formed bullish divergences and broke out last week. The Nasdaq 100 AD Volume Line also formed a bullish divergence and broke out. Just as important, all three of these breadth indicators are trading above their early April highs and show strength.

**This chart analysis is for educational purposes only, and should not
be construed as a recommendation to buy, sell or sell-short said securities**
**************************************************************
SPY has been pretty flat since late February with several moves above/below the 185 level. The swings, however, widened in April with a downswing from 189.6 to 181.2 and an upswing back up to the 188 area. Basically, SPY failed to hold the support break at 184 and broke resistance with a gap up last week. I will reset support in the 184-185 area.

**************************************************************
QQQ has been trending lower since early March with a series of lower highs. The ETF, however, broke out last week and surged above 87.5 this week. Resistance could come soon from the 9-Apr high and 62% retracement, but I would pay more attention to the current upswing and mark upswing support at 85.5 for now. Note that AAPL, BIIB and QCOM report today.

**************************************************************
IWM surged from 109 to 115 over the past week and has now retraced 62% of the early April decline. The ETF is getting a little overbought and near resistance from the 9-Apr high, but the swing here is clearly up with support near the breakout at 112. Relative weakness in small-caps remains at concern overall.

**************************************************************
The 20+ YR T-Bond ETF (TLT) has been zigzagging higher since late February, but suddenly reversed as stocks surged last week. Notice how TLT reversed at the channel trend line and broke first support. This is potentially positive for stocks and first resistance is set at 110.65. The lower trend line and mid April lows mark channel support in the 108.5-109 area.

**************************************************************
The US Dollar ETF (UUP) surged above 21.55 in early April, but failed to hold these gains and fell back to the mid March lows on 10-April. The Euro Index ($XEU) holds the key to the Dollar. XEU fell to 138 last week and then consolidated. A break below 137.9 would be Euro negative and Dollar positive. Watch out though. The Euro is one resilient currency and a break above 139 would be bullish.

**************************************************************
The USO Oil Fund (USO) formed a triangle in early April and broke triangle resistance with a surge the second week of April. After stalling in the 37.5-37.75 area last week, the ETF fell sharply on Tuesday and is nearing its first support zone. Broken resistance and the trend line zone extending up from mid March mark support in the 36.5-36.8 area.

**************************************************************
Gold continues to follow the Euro. Or maybe the Euro is following gold. Either way, these two are positively correlated. Notice how both rose into mid March, fell in the second half of March, bounced in early April and then fell over the last seven days. GLD hit resistance at broken support and the 50% retracement. The channel support break reversed the April upswing and gold is short-term bearish right now.

***************************************************************
Key Reports and Events (all times Eastern):
Wed - Apr 23 - 07:00 - MBA Mortgage Index
Wed - Apr 23 - 10:00 - New Home Sales
Wed - Apr 23 - 10:30 - Crude Oil Inventories
Thu - Apr 24 - 08:30 - Initial Jobless Claims
Thu - Apr 24 - 08:30 - Durable Goods Orders
Thu - Apr 24 - 10:30 - Natural Gas Inventories
Fri - Apr 25 - 09:55 - Michigan Sentiment
This commentary and charts-of-interest are designed to stimulate thinking. This analysis is
not a recommendation to buy, sell, hold or sell short any security (stock ETF or otherwise).
We all need to think for ourselves when it comes to trading our own accounts. First, it is
the only way to really learn. Second, we are the only ones responsible for our decisions.
Think of these charts as food for further analysis. Before making a trade, it is important
to have a plan. Plan the trade and trade the plan. Among other things, this includes setting
a trigger level, a target area and a stop-loss level. It is also important to plan for three
possible price movements: advance, decline or sideways. Have a plan for all three scenarios
BEFORE making the trade. Consider possible holding times. And finally, look at overall market
conditions and sector/industry performance.

About the author:
Arthur Hill, CMT, is the Chief Technical Strategist at TrendInvestorPro.com. Focusing predominantly on US equities and ETFs, his systematic approach of identifying trend, finding signals within the trend, and setting key price levels has made him an esteemed market technician. Arthur has written articles for numerous financial publications including Barrons and Stocks & Commodities Magazine. In addition to his Chartered Market Technician (CMT) designation, he holds an MBA from the Cass Business School at City University in London.
Learn More
