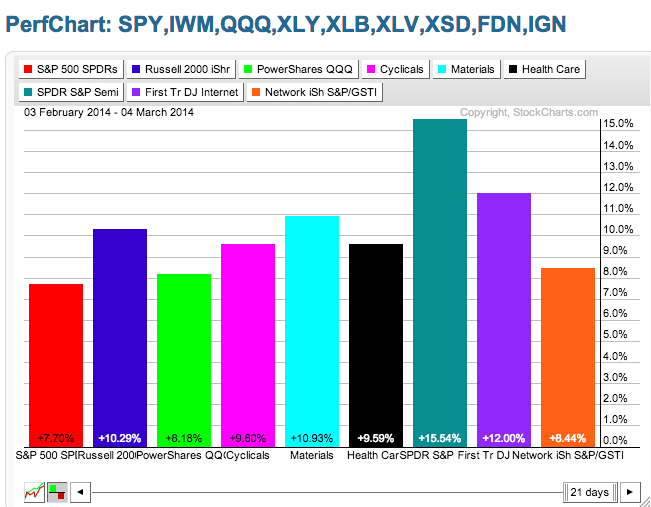
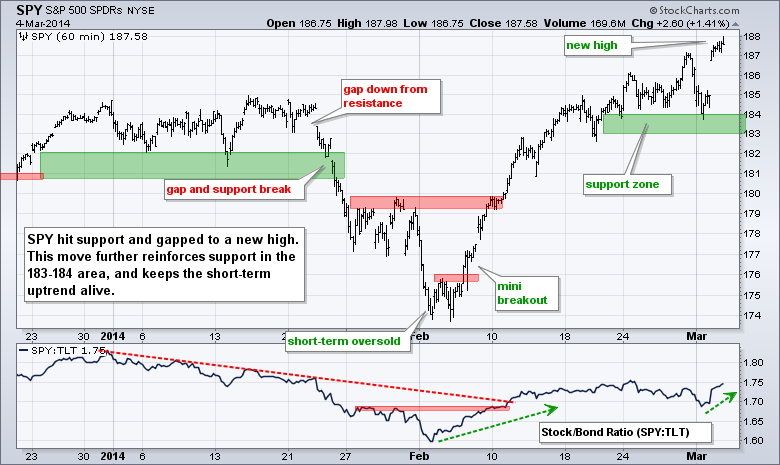
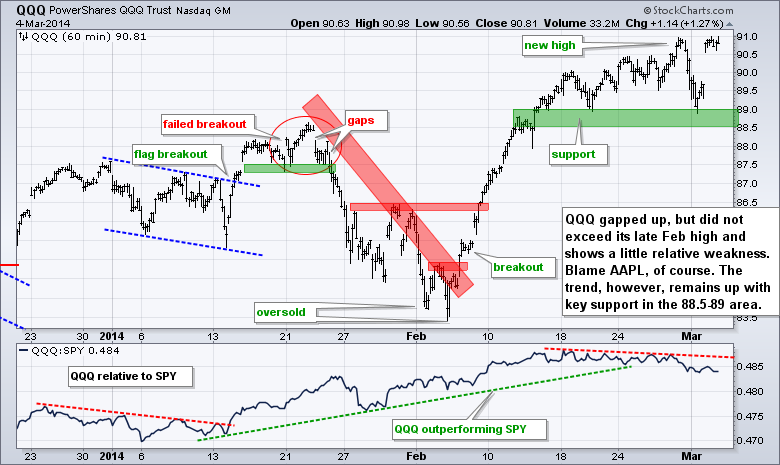
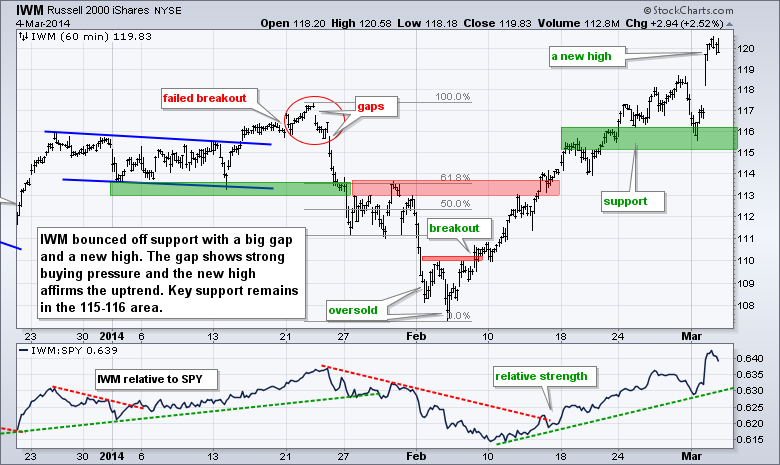
Stocks surged on the open with the major index ETFs gapping substantially higher. There was some, but not much follow through after the gap, which suggest that most of the buying pressure occurred in the first twenty minutes. As noted in yesterday's Market Message, there are some pretty rational reasons for Tuesday's surge. The beginning of the month has a strong bullish bias, but stocks dipped on Monday because of the situation in Ukraine. Funds collect inflows during the month and put them to work at the beginning of the next month. Flows must have been pretty good with February's strong run. Fund managers held back on Monday and this created pent-up demand on Tuesday, which is also known as turnaround Tuesday. It also became clear that the events in Ukraine would not have a material affect on US companies. Even though gaps and new highs are certainly positive and show strong buying pressure, note that these gaps occurred after strong run-ups in February. At best, they are continuation gaps. The short-term trends are clearly up, but I remain concerned with short-term overbought conditions. As the PerfChart below shows, the gains over the last four weeks are extraordinary. This suggests that stocks could more sideways or correct in the coming one to four weeks. Also note that the stock market is once again priced for perfection and it is an big week for economic reports.
**This chart analysis is for educational purposes only, and should not
be construed as a recommendation to buy, sell or sell-short said securities**
**************************************************************
**************************************************************
**************************************************************
**************************************************************
***************************************************************
Key Reports and Events (all times Eastern):
Wed - Mar 05 - 07:00 - MBA Mortgage Index
Wed - Mar 05 - 08:15 - ADP Employment Report
Wed - Mar 05 - 10:00 - ISM Services
Wed - Mar 05 - 10:30 - Crude Oil Inventories
Wed - Mar 05 - 14:00 - Fed's Beige Book
Thu - Mar 06 - 07:30 - Challenger Job Report
Thu - Mar 06 - 08:30 - Initial Jobless Claims
Thu - Mar 06 - 08:30 - Continuing Claims
Thu - Mar 06 - 10:00 - Factory Orders
Thu - Mar 06 - 10:30 - Natural Gas Inventories
Fri - Mar 07 - 08:30 - Employment
Charts of Interest: Tuesday and Thursday
This commentary and charts-of-interest are designed to stimulate thinking. This analysis is
not a recommendation to buy, sell, hold or sell short any security (stock ETF or otherwise).
We all need to think for ourselves when it comes to trading our own accounts. First, it is
the only way to really learn. Second, we are the only ones responsible for our decisions.
Think of these charts as food for further analysis. Before making a trade, it is important
to have a plan. Plan the trade and trade the plan. Among other things, this includes setting
a trigger level, a target area and a stop-loss level. It is also important to plan for three
possible price movements: advance, decline or sideways. Have a plan for all three scenarios
BEFORE making the trade. Consider possible holding times. And finally, look at overall market
conditions and sector/industry performance.

