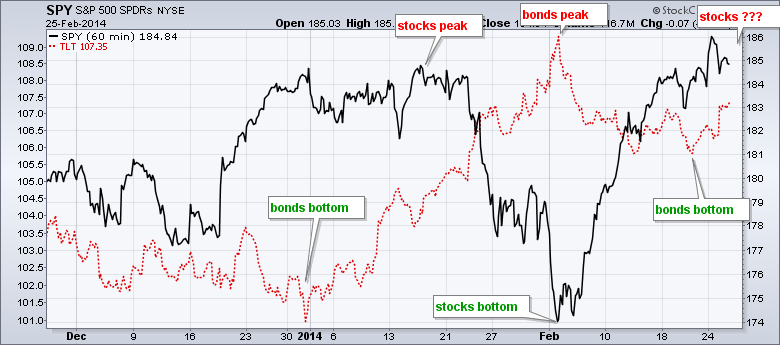
Stocks meandered on Tuesday with some buying interest in the morning and selling pressure in the afternoon. The major index ETFs finished mixed with the Russell 2000 ETF (IWM) edging higher (.10%) and the S&P 500 SPDR (SPY) closing fractionally lower (-.04%). The sectors were also mixed with six down and three up. The Consumer Discretionary SPDR (XLY) led with a .70% gain as strength in retail pushed this key sector higher. Also note that the Home Construction iShares (ITB) added 1.11% and hit a new high to continue its leadership run. Overall, stocks remain a bit frothy after big runs, but we have yet to see any serious selling pressure. After a sharp surge at the beginning of the month, the advance slowed and upside momentum took a dip. Less upside momentum is still positive because we have yet to see any downside momentum. I am watching Treasuries quite closely because the 20+ YR T-Bond ETF (TLT) surged almost 1% and broke its range on Tuesday. Long-term, the ETF is getting a bounce off the 200-day moving average. Strength in Treasuries could be negative for stocks because it suggests a certain risk aversion moving into the market place. The chart below reflects a negative correlation between stocks and Treasuries in 2014. Bonds bottomed last week and this could foreshadow a short-term peak in stocks.
**This chart analysis is for educational purposes only, and should not
be construed as a recommendation to buy, sell or sell-short said securities**


**************************************************************

**************************************************************

**************************************************************

**************************************************************

***************************************************************
Key Reports and Events (all times Eastern):
Wed - Feb 26 - 07:00 - MBA Mortgage Index
Wed - Feb 26 - 10:00 - New Home Sales
Wed - Feb 26 - 10:30 - Crude Oil Inventories
Thu - Feb 27 - 08:30 - Initial Jobless Claims
Thu - Feb 27 - 08:30 - Durable Good Orders
Thu - Feb 27 - 10:30 - Natural Gas Inventories
Fri - Feb 28 - 08:30 - GDP
Fri - Feb 28 - 09:45 - Chicago PMI
Fri - Feb 28 - 09:55 - Michigan Sentiment
Fri - Feb 28 - 10:00 - Pending Home Sales
Charts of Interest: Tuesday and Thursday
This commentary and charts-of-interest are designed to stimulate thinking. This analysis is
not a recommendation to buy, sell, hold or sell short any security (stock ETF or otherwise).
We all need to think for ourselves when it comes to trading our own accounts. First, it is
the only way to really learn. Second, we are the only ones responsible for our decisions.
Think of these charts as food for further analysis. Before making a trade, it is important
to have a plan. Plan the trade and trade the plan. Among other things, this includes setting
a trigger level, a target area and a stop-loss level. It is also important to plan for three
possible price movements: advance, decline or sideways. Have a plan for all three scenarios
BEFORE making the trade. Consider possible holding times. And finally, look at overall market
conditions and sector/industry performance.

