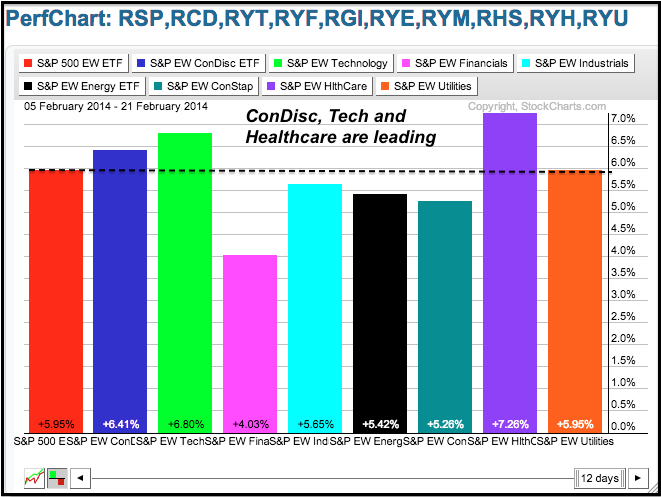
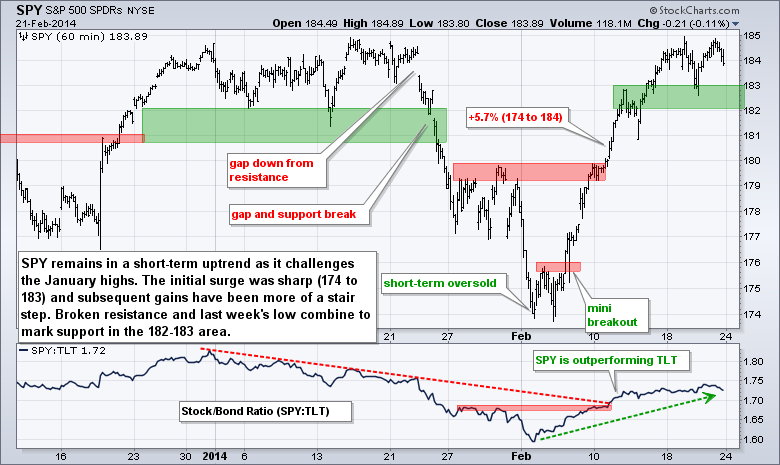
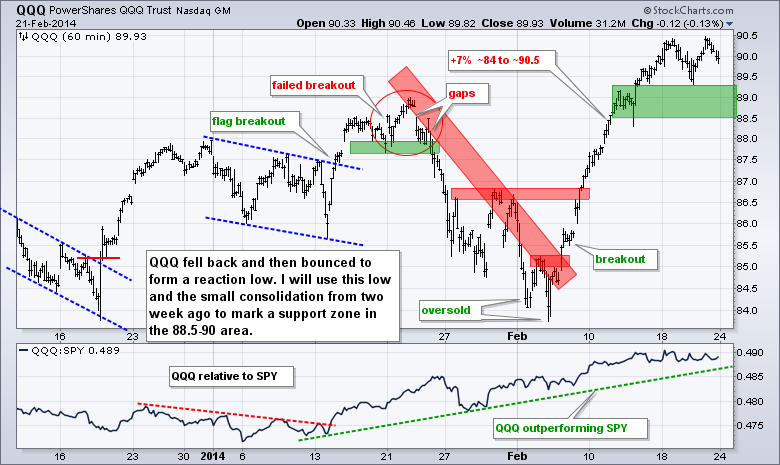
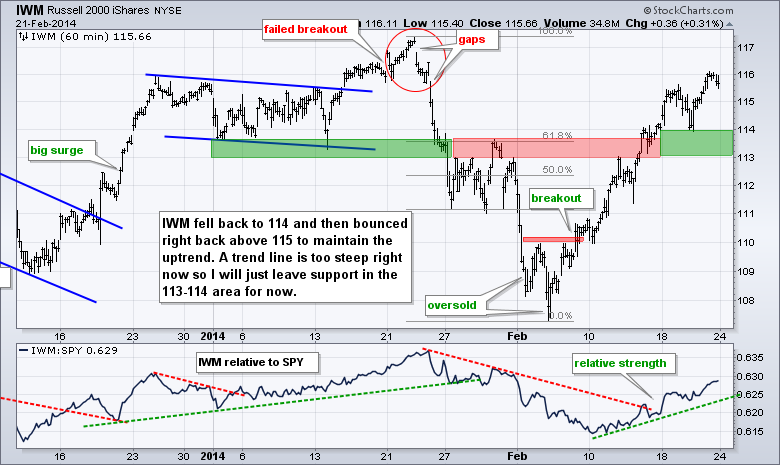
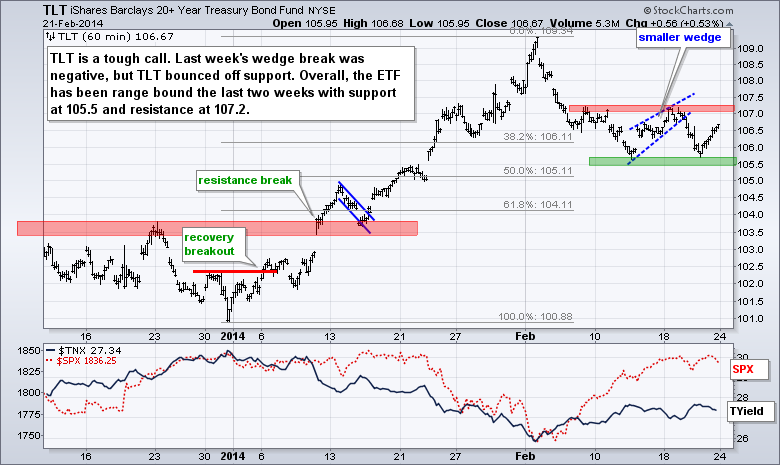
The major index ETFs dipped in the first half of the week and rebounded in the second half to extend their short-term uptrends. Even though these short-term uptrends look extended after sharp advances, there are no signs of weakness and the market is seeing strength in the right places. Also note that stocks are rising in the face of negative economic news. Retail sales were weak, housing starts and building permits declined, and industrial production dipped. As far as leadership is concerned, the S&P MidCap SPDR (MDY) and Russell 2000 ETF (IWM) led the rebound and closed at new highs for the month (February). Relative strength in small and mid caps is a positive for the market overall. The S&P 500 SPDR (SPY) is outperforming the 20+ YR T-Bond ETF (TLT) this month, which suggests that money favors stocks over bonds. Looking at the sectors, the Equal-Weight Consumer Discretionary ETF (RCD), Equal-weight Technology ETF (RYT) and the Equal-weight Healthcare ETF (RYH) are leading this February surge. Again it is positive to see the consumer discretionary and technology sectors showing relative strength. This week's economic docket is heavy on housing numbers with Case-Shiller on Tuesday, New Home Sales on Wednesday and Pending Home Sales on Friday.
**This chart analysis is for educational purposes only, and should not
be construed as a recommendation to buy, sell or sell-short said securities**
**************************************************************
**************************************************************
**************************************************************
**************************************************************
***************************************************************
Key Reports and Events (all times Eastern):
Tue - Feb 25 - 09:00 - Case-Shiller Housing Index
Tue - Feb 25 - 09:00 - FHFA Housing Price Index
Tue - Feb 25 - 10:00 - Consumer Confidence
Wed - Feb 26 - 07:00 - MBA Mortgage Index
Wed - Feb 26 - 10:00 - New Home Sales
Wed - Feb 26 - 10:30 - Crude Oil Inventories
Thu - Feb 27 - 08:30 - Initial Jobless Claims
Thu - Feb 27 - 08:30 - Durable Good Orders
Thu - Feb 27 - 10:30 - Natural Gas Inventories
Fri - Feb 28 - 08:30 - GDP
Fri - Feb 28 - 09:45 - Chicago PMI
Fri - Feb 28 - 09:55 - Michigan Sentiment
Fri - Feb 28 - 10:00 - Pending Home Sales
Charts of Interest: Tuesday and Thursday
This commentary and charts-of-interest are designed to stimulate thinking. This analysis is
not a recommendation to buy, sell, hold or sell short any security (stock ETF or otherwise).
We all need to think for ourselves when it comes to trading our own accounts. First, it is
the only way to really learn. Second, we are the only ones responsible for our decisions.
Think of these charts as food for further analysis. Before making a trade, it is important
to have a plan. Plan the trade and trade the plan. Among other things, this includes setting
a trigger level, a target area and a stop-loss level. It is also important to plan for three
possible price movements: advance, decline or sideways. Have a plan for all three scenarios
BEFORE making the trade. Consider possible holding times. And finally, look at overall market
conditions and sector/industry performance.

