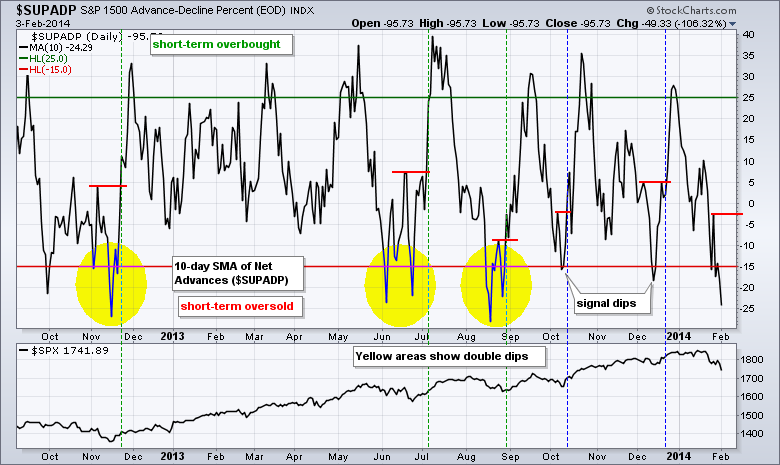
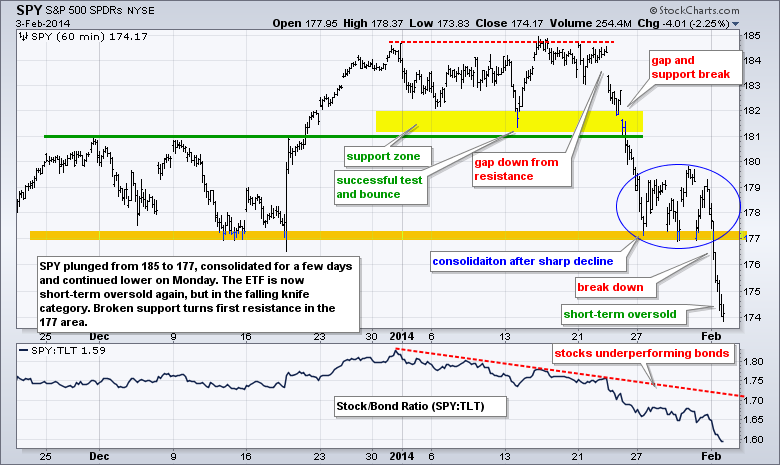
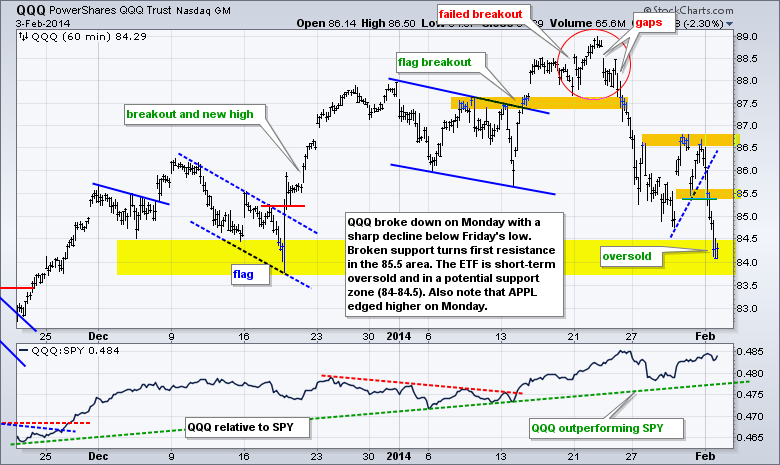
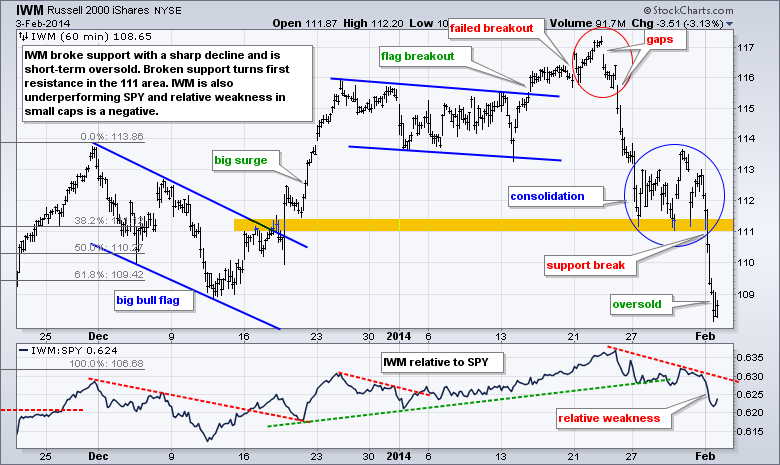
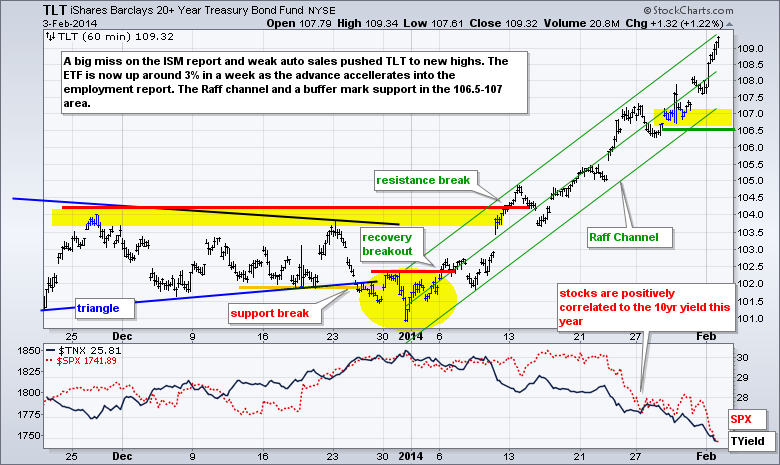
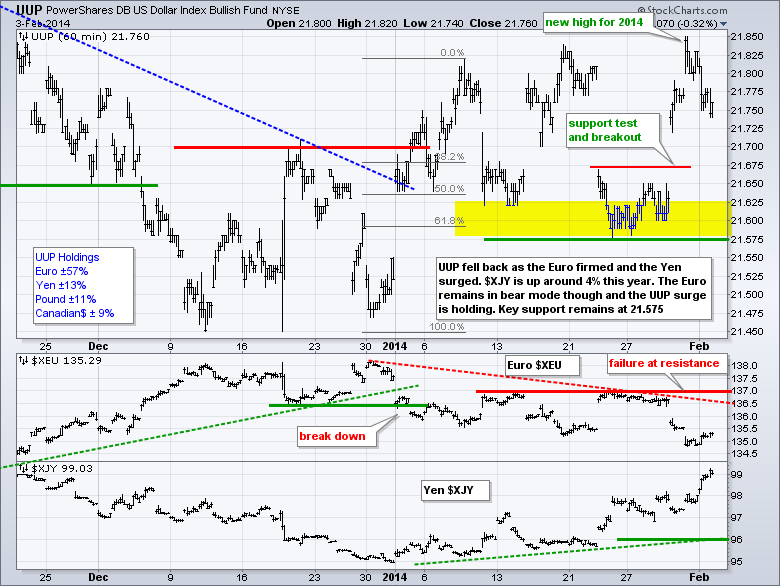
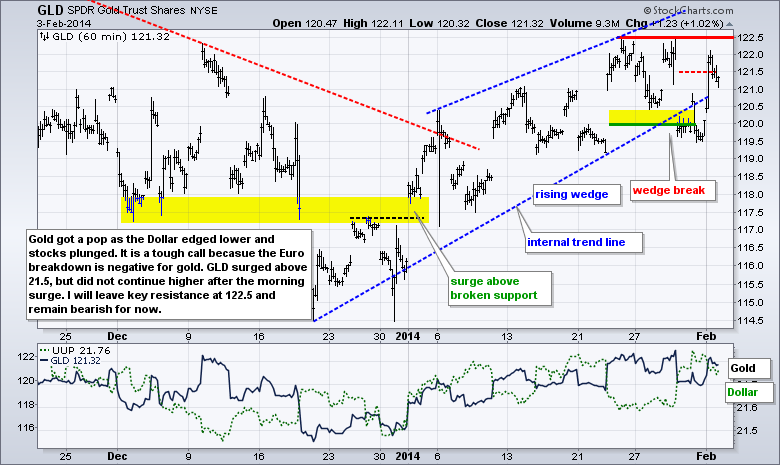
Stocks got slammed as the perfect storm just got more perfect. The list of negatives continues to grow. Starting internally, stocks were ripe for a correction in mid January and the Consumer Discretionary SPDR (XLY) has underperformed the entire year. Externally, the 20+ YR T-Bond ETF (TLT) has outperformed the S&P 500 in 2014 as money moved into relative safety. Weakness in emerging market equities and currencies got the blame last week. This week a big miss on the ISM Manufacturing Index and weak auto/truck sales added to stock market woes. Small-caps led the decline with the Russell 2000 ETF (IWM) falling just over 3%. All sectors were down with the Consumer Discretionary SPDR (XLY), Finance SPDR (XLF) and Industrials SPDR (XLI) falling over 2%. Selling pressure all industry groups, including the gold miners. Gold moved higher, but this advance was not confirmed with strength in the Gold Miners ETF (GDX). For the second Monday running, the major index ETFs are oversold and the bigger trend remains up. Given the strength of selling pressure, I think we may be setting up for some sort of double dip that could involve a selling climax at some point. The chart below shows the 10-day SMA for S&P 1500 AD Percent ($SUPADP). The signal dip strategy did not work because stocks moved lower on Friday and Monday. The yellow areas show prior double dips that occurred over a ten to twenty day period. The double dip turns into a buy signal when the indicator breaks the intermittent high (green lines). While we may see an oversold bounce for a few days, this scenario suggests that we will not see a decent low for another one to three weeks. 1700 seems to be the line that most strategists are watching and this may become a sell fulfilling prophecy.
**This chart analysis is for educational purposes only, and should not
be construed as a recommendation to buy, sell or sell-short said securities**
**************************************************************
**************************************************************
**************************************************************
**************************************************************
***************************************************************
Key Reports and Events (all times Eastern):
Tue - Feb 04 - 10:00 - Factory Orders
Wed - Feb 05 - 07:00 - MBA Mortgage Index
Wed - Feb 05 - 08:15 - ADP Employment Report
Wed - Feb 05 - 10:00 - ISM Services Index
Wed - Feb 05 - 10:30 - Crude Inventories
Thu - Feb 06 - 07:30 - Challenger Job Report
Thu - Feb 06 - 08:30 - Initial Jobless Claims
Thu - Feb 06 - 10:30 - Natural Gas Inventories
Fri - Feb 07 - 08:30 - Employment Report
Tue - Feb 11 - 08:30 - Yellen Testimony
Charts of Interest: Tuesday and Thursday
This commentary and charts-of-interest are designed to stimulate thinking. This analysis is
not a recommendation to buy, sell, hold or sell short any security (stock ETF or otherwise).
We all need to think for ourselves when it comes to trading our own accounts. First, it is
the only way to really learn. Second, we are the only ones responsible for our decisions.
Think of these charts as food for further analysis. Before making a trade, it is important
to have a plan. Plan the trade and trade the plan. Among other things, this includes setting
a trigger level, a target area and a stop-loss level. It is also important to plan for three
possible price movements: advance, decline or sideways. Have a plan for all three scenarios
BEFORE making the trade. Consider possible holding times. And finally, look at overall market
conditions and sector/industry performance.

