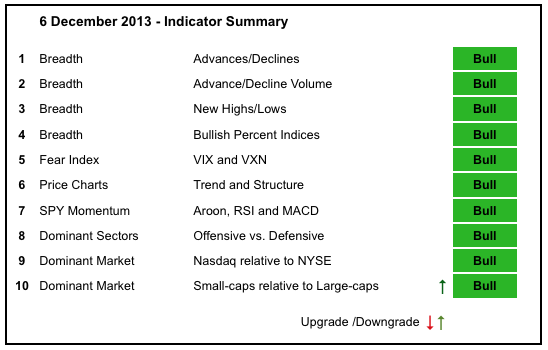
The bulk of the evidence remains bullish as stocks continue in strong uptrends. The Nasdaq AD Line and AD Volume Line hit new highs as techs led the market in November. The NYSE AD Line and AD Volume Line are lagging somewhat, but are nowhere close to breaking down and showing weakness. All five of the major index ETFs hit new highs in November. The S&P MidCap 400 ETF (MDY) is lagging a bit over the last two weeks, but has yet to actually break down or show significant selling pressure.
- AD Lines: Bullish. The Nasdaq AD Line hit a new high at the end of November and remains in a uptrend. The NYSE AD Line hit a new high in late October and then stalled out. This indicator has been lagging for six months now, but remains in an uptrend overall.
- AD Volume Lines: Bullish. The Nasdaq AD Volume Line hit a new high in late November and pulled back the last four days. No downtrend here. The NYSE AD Volume Line peaked in mid November and did not exceed this high in late November. A small bearish divergence is taking shape, but the overall trend remains up.
- Net New Highs: Bullish. Net New Highs on both the Nasdaq and the NYSE surged in November and then fell back over the last few days. The cumulative lines hit new highs and remain above their 10-day EMAs.
- Bullish Percent Indices: Bullish. All nine sector Bullish Percent Indices are above 50%.
- VIX/VXN: Bullish. The S&P 500 Volatility Index ($VIX) and the Nasdaq 100 Volatility Index ($VXN) fell back to the low end of their 2013 ranges and surged the last six days. Both remain at low levels overall and low volatility is positive for the stock market.
- Trend-Structure: Bullish. The five major index ETFs hit new highs in November and remain in long-term uptrends (DIA, SPY, MDY, IWM and QQQ).
- SPY Momentum: Bullish. RSI bounced off the 40-50 zone and MACD (5,35,5) turned up near the zero line in early October. The Aroon Oscillator turned up and moved above +50 in late October.
- Offensive Sector Performance: Bullish. XLY, XLK and XLI hit new highs in late November and all four offensive sectors are participating in the broad market advance.
- Nasdaq Performance: Bullish. The $COMPQ:$NYA ratio stalled from mid October to mid November and then surged to new highs over the last few weeks.
- Small-cap Performance: Bullish. The $RUT:$OEX ratio fell sharply from early October to mid November, but then surged over the last two weeks. There is a small breakout underway and I will upgrade this indicator to bullish.
- Breadth charts (here) and intermarket charts (here) have been updated.
This table is designed to offer an objective look at current market conditions. It does not aim to pick tops or bottoms. Instead, it seeks to identify noticeable shifts in buying and selling pressure.
This commentary and charts-of-interest are designed to stimulate thinking. This analysis is not a recommendation to buy, sell, hold or sell short any security (stock ETF or otherwise). We all need to think for ourselves when it comes to trading our own accounts. First, it is the only way to really learn. Second, we are the only ones responsible for our decisions. Think of these charts as food for further analysis. Before making a trade, it is important to have a plan. Plan the trade and trade the plan. Among other things, this includes setting a trigger level, a target area and a stop-loss level. It is also important to plan for three possible price movements: advance, decline or sideways. Have a plan for all three scenarios BEFORE making the trade. Consider possible holding times. And finally, look at overall market conditions and sector/industry performance.

