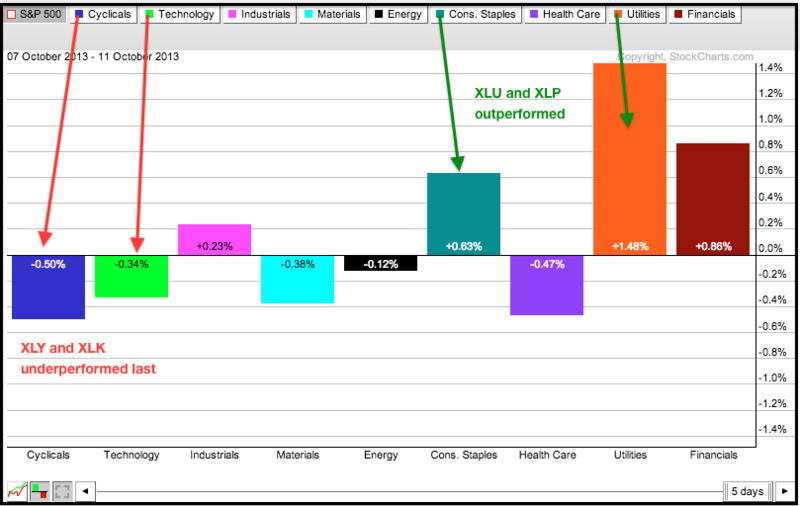
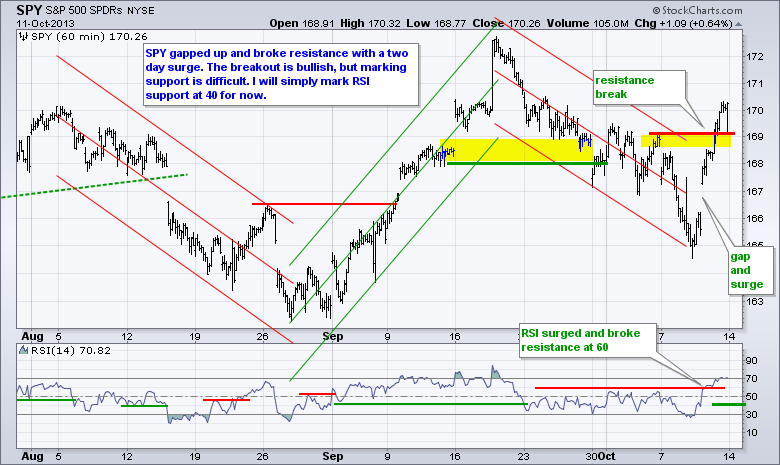
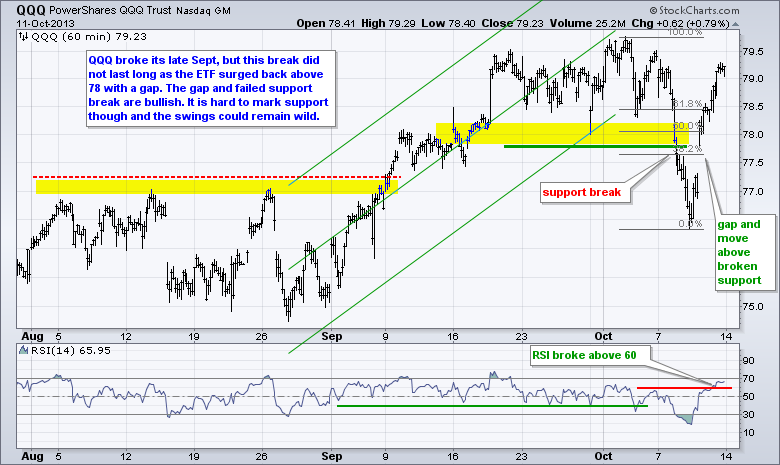
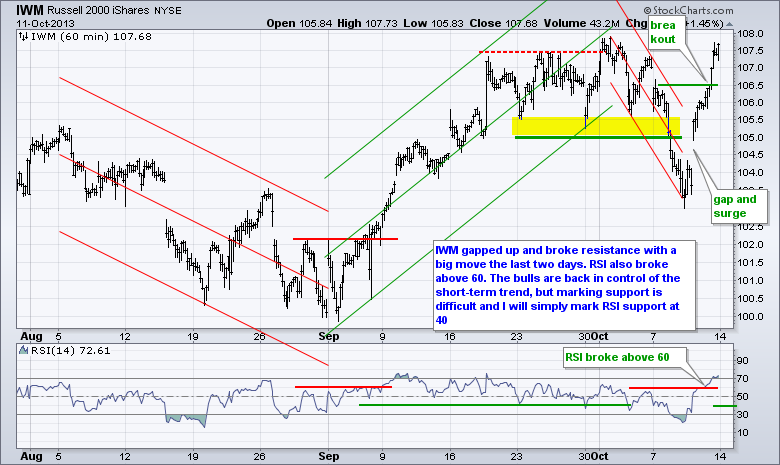
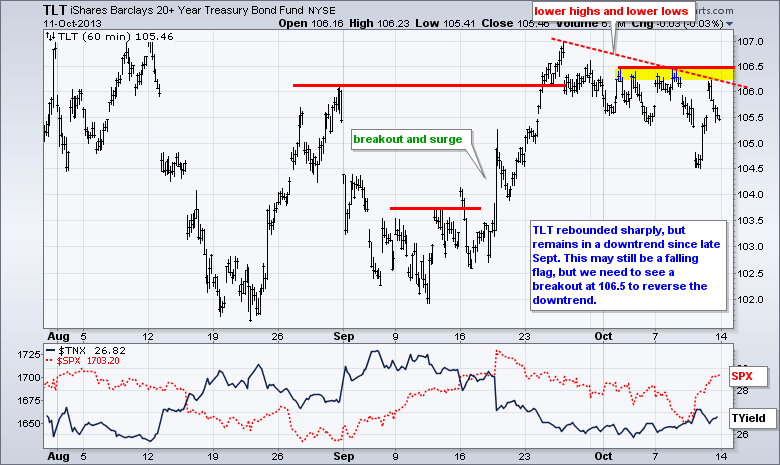
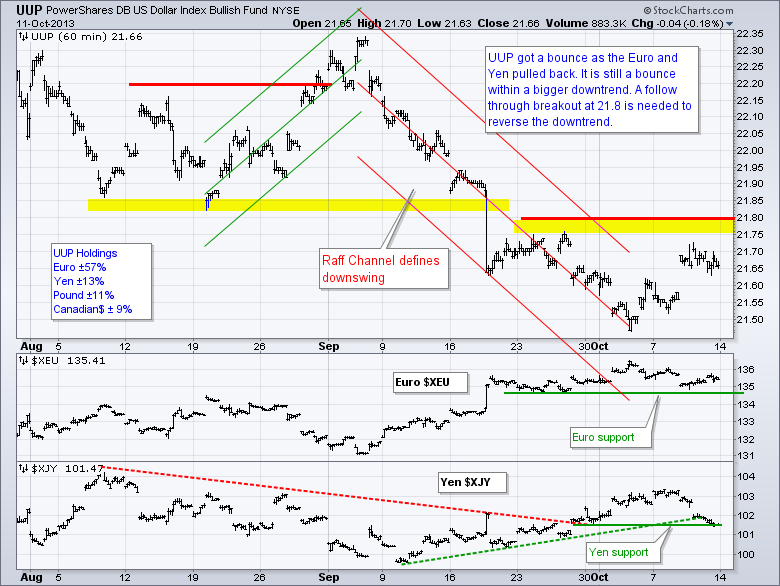
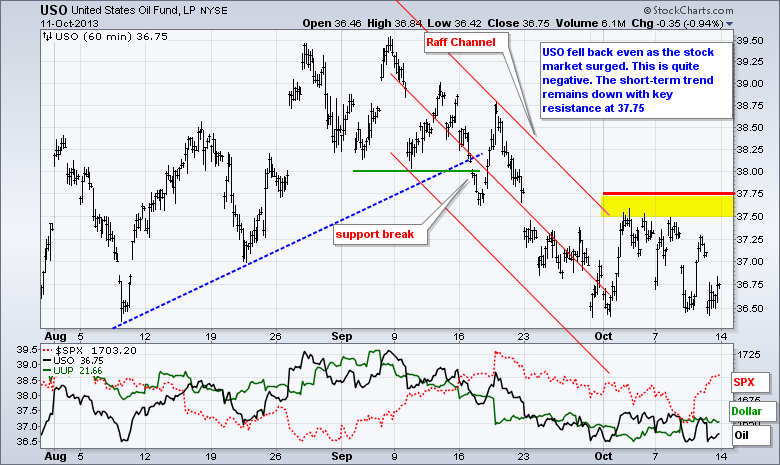
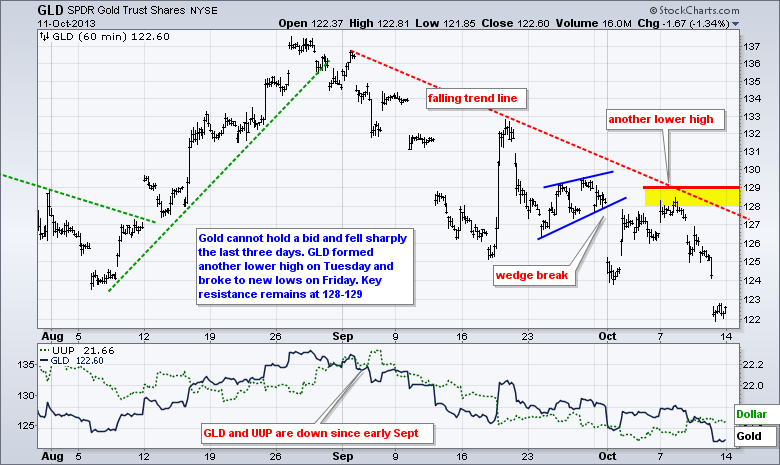
Signs of hope dissipated over the weekend as the war of words took over in Washington. It is hard to say what is a negotiating ploy and what it substantive. One this seems for sure though: this is going to go down to the wire and any deal will likely come at the last minute. With the situation in Washington remaining "fluid", the markets are likely to remain volatile. The S&P 500 ETF (SPY) surged around 3% from midday Wednesday to Friday afternoon. Stock futures are down in early trading and this suggests that SPY will give up about a third of this gain. With last week's gaps and breakouts, the short-term trends are up for the major index ETFs. However, it is difficult to mark key support levels and volatility could play havoc on stops. Also keep in mind that earnings season gets into full swing this week and this could further exasperate volatility. Despite last week's rally, sector performance was uninspiring because the Utilities SPDR (XLU) and Consumer Staples SPDR (XLP) lead the market last week. The Finance SPDR (XLF) also showed leadership, but the Consumer Discretionary SPDR (XLY) and Technology SPDR (XLK) underperformed. Outside of stocks, there is a slow downtrend in TLT and clear resistance level to watch. Oil failed to follow stocks higher last week and shows relative weakness. Gold cannot hold a bid at all and moved to a new low.
**This chart analysis is for educational purposes only, and should not
be construed as a recommendation to buy, sell or sell-short said securities**
**************************************************************
**************************************************************
**************************************************************
**************************************************************
***************************************************************
Key Reports and Events (all times Eastern):
No government reports during the shutdown
Tue - Oct 15 - 08:30 - Empire Manufacturing
Wed - Oct 16 - 07:00 - MBA Mortgage Index
Wed - Oct 16 - 08:30 - Consumer Price Index (CPI)
Wed - Oct 16 - 10:00 - NAHB Housing Market Index
Wed - Oct 16 - 14:00 - Fed's Beige Book
Thu - Oct 17 - 08:30 - Initial Jobless Claims
Thu - Oct 17 - 08:30 - Housing Starts & Building Permits
Thu - Oct 17 - 09:15 - Industrial Production
Thu - Oct 17 - 10:00 - Philadelphia Fed
Thu - Oct 17 - 10:30 - Natural Gas Inventories
Thu - Oct 17 - 11:00 - Crude Oil Inventories
Thu - Oct 17 - 23:59 - Debt Ceiling Deadline
Fri - Oct 18 - 10:00 - Leading Economic Indicators
Thu - Oct 24 - 09:00 - Government Runs out of Money (estimate)
Charts of Interest: Tuesday and Thursday
This commentary and charts-of-interest are designed to stimulate thinking. This analysis is
not a recommendation to buy, sell, hold or sell short any security (stock ETF or otherwise).
We all need to think for ourselves when it comes to trading our own accounts. First, it is
the only way to really learn. Second, we are the only ones responsible for our decisions.
Think of these charts as food for further analysis. Before making a trade, it is important
to have a plan. Plan the trade and trade the plan. Among other things, this includes setting
a trigger level, a target area and a stop-loss level. It is also important to plan for three
possible price movements: advance, decline or sideways. Have a plan for all three scenarios
BEFORE making the trade. Consider possible holding times. And finally, look at overall market
conditions and sector/industry performance.

