**This chart analysis is for educational purposes only, and should not
be construed as a recommendation to buy, sell or sell-short said securities**
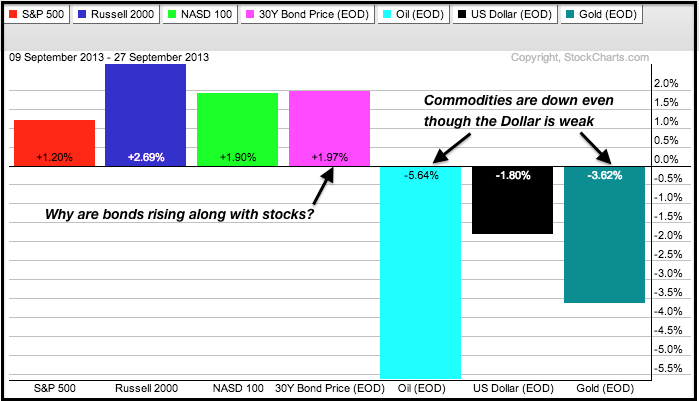
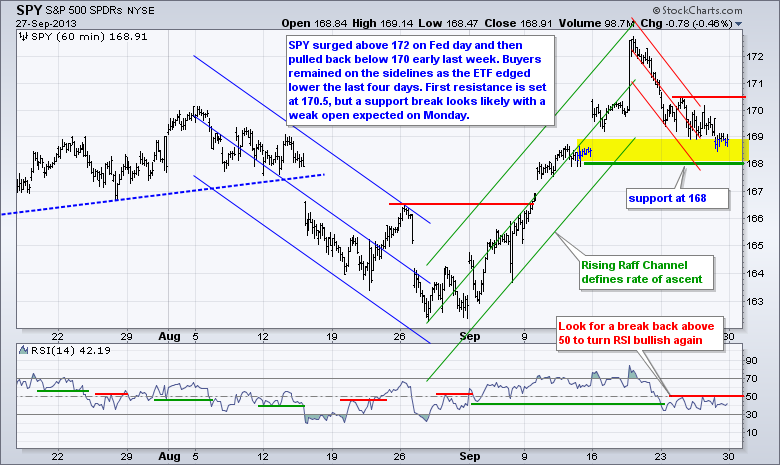
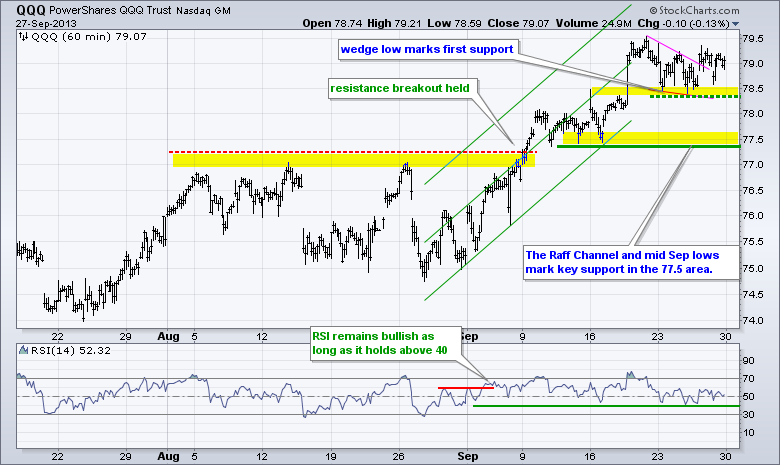
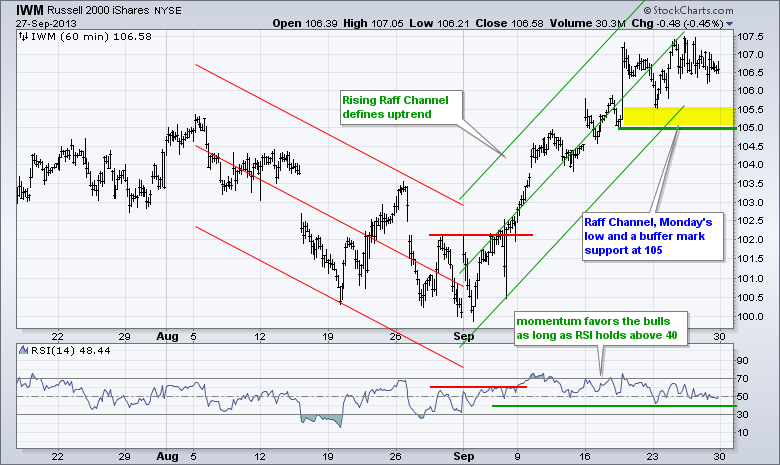
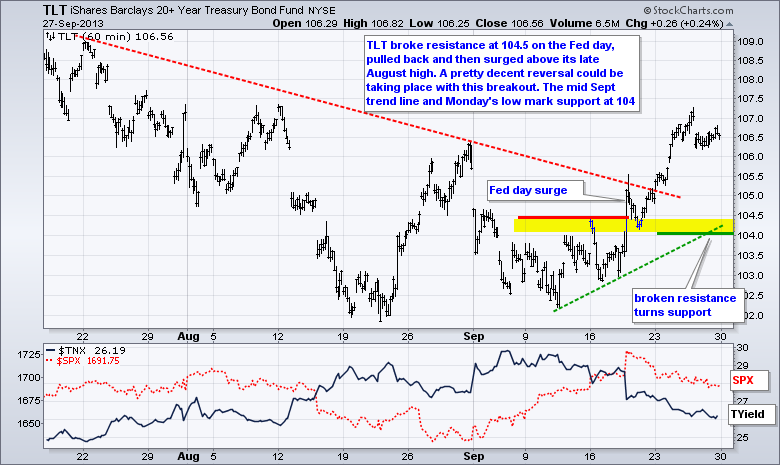
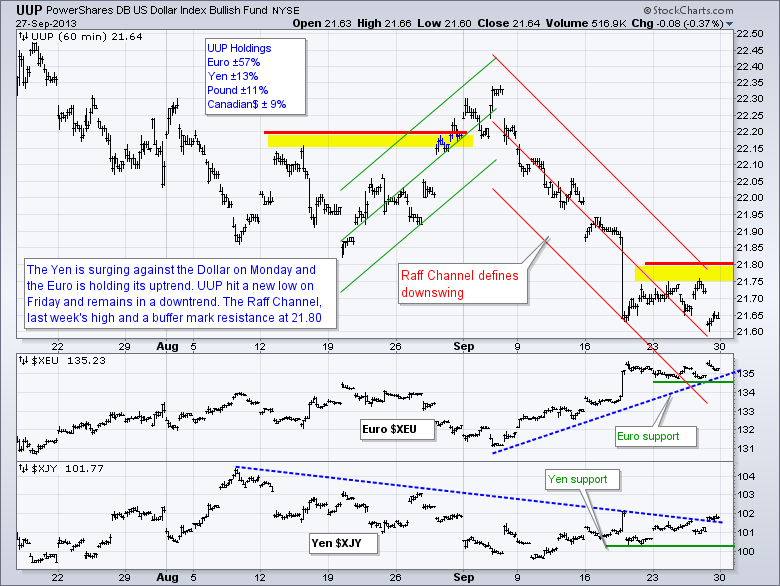
Stock futures are trading sharply lower as the first government shut down in 17 years looms on the horizon. This little shutdown charade is not the only big item on the agenda in the coming weeks. The economic docket is full with the employment report scheduled on Friday. Once this passes, we can start looking forward to some debt ceiling theater. The Treasury estimates that we will reach the debt ceiling on October 17th and analysts estimate that the government will run out of money around the 24th. Boy, I sure picked a bad week to quit smoking and drinking. Oh, and don't forget that there is a political crisis brewing in Italy and the yields on Italian government bonds surged. The Yen surged against the Dollar early Monday and the Nikkei 225 ($NIKK) fell around 2%. It is beginning to look like August 2011 all over again. US stocks remain in short-term uptrends, but we are seeing relative weakness in the S&P 500 ETF (SPY) and the Finance SPDR (XLF). The Russell 2000 ETF (IWM) and the Nasdaq 100 ETF (QQQ) have yet to break short-term support levels. Stocks had a good run so far this month with the Russell 2000 (small-caps) leading the charge. Despite strength in stocks, the 30-year US Treasury bond also rose the last three weeks. This creates an awkward dynamic because stocks and bonds are typically negatively correlated. At least they have been negatively correlated for several years now. Something may need to give because strength in Treasuries signals a risk-aversion in the market place, which could be negative for stocks.

**************************************************************************
**************************************************************************
**************************************************************************
**************************************************************************
**************************************************************************
Key Reports and Events (all times Eastern):
Mon - Sep 30 - 09:45 - Chicago PMI
Mon - Sep 30 - 23:59 - Shutdown Deadline
Tue - Oct 01 - 10:00 - ISM Manufacturing Index
Tue - Oct 01 - 10:00 - Construction Spending
Tue - Oct 01 - 14:00 - Auto Sales
Wed - Oct 02 - 07:00 - MBA Mortgage Index
Wed - Oct 02 - 08:15 - ADP Employment Change
Wed - Oct 02 - 10:30 – Crude Oil Inventories
Thu - Oct 03 - 07:30 - Challenger Job Cuts
Thu - Oct 03 - 08:30 - Initial Jobless Claims
Thu - Oct 03 - 10:00 - Factory Orders
Thu - Oct 03 - 10:00 - ISM Services Index
Thu - Oct 03 - 10:30 - Natural Gas Inventories
Fri - Oct 04 - 08:30 – Employment Report
Thu - Oct 17 - 23:59 - Debt Ceiling Deadline
Thu - Oct 24 - 09:00 - Government Runs out of Money (estimate)
Charts of Interest: Tuesday and Thursday
This commentary and charts-of-interest are designed to stimulate thinking. This analysis is
not a recommendation to buy, sell, hold or sell short any security (stock ETF or otherwise).
We all need to think for ourselves when it comes to trading our own accounts. First, it is
the only way to really learn. Second, we are the only ones responsible for our decisions.
Think of these charts as food for further analysis. Before making a trade, it is important
to have a plan. Plan the trade and trade the plan. Among other things, this includes setting
a trigger level, a target area and a stop-loss level. It is also important to plan for three
possible price movements: advance, decline or sideways. Have a plan for all three scenarios
BEFORE making the trade. Consider possible holding times. And finally, look at overall market
conditions and sector/industry performance.

About the author:
Arthur Hill, CMT, is the Chief Technical Strategist at TrendInvestorPro.com. Focusing predominantly on US equities and ETFs, his systematic approach of identifying trend, finding signals within the trend, and setting key price levels has made him an esteemed market technician. Arthur has written articles for numerous financial publications including Barrons and Stocks & Commodities Magazine. In addition to his Chartered Market Technician (CMT) designation, he holds an MBA from the Cass Business School at City University in London.
Learn More