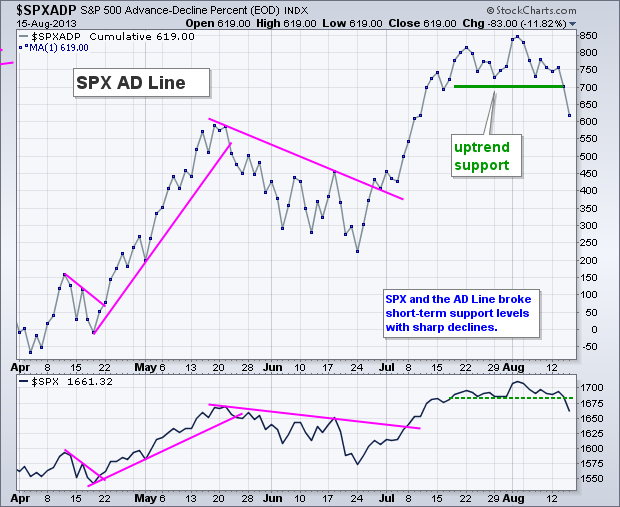
Selling pressure certainly intensified on Thursday with an across the board decline. The high-beta Russell 2000 ETF (IWM) led the major index ETFs lower with a 1.82 percent decline. All sectors were down with the Consumer Discretionary SPDR (XLY) leading the way. It is negative to see this economically sensitive sector leading during a decline. Retailers weighed heavily on the consumer discretionary as the Retail SPDR (XRT) fell almost 2 percent and ended the day right at support from the late July low. The charts below show the S&P 500 AD Line ($SUPADP) and the S&P 500 AD Volume Line ($SUPUDP) falling the most since June. Both clearly broke short-term support levels and the stock market is now in corrective mode. On a side note, it was a bit of a shock to see the 20+ Year T-Bond ETF (TLT) fall along with the stock market. However, TLT is falling because the 10-year Treasury Yield ($TNX) is moving back to normalcy.


**************************************************************************

**************************************************************************

**************************************************************************

**************************************************************************

**************************************************************************
Key Reports and Events (all times Eastern):
Fri - Aug 16 - 08:30 - Housing Starts/Building Permits
Fri - Aug 16 - 09:55 - Michigan Sentiment
Charts of Interest: Tuesday and Thursday
This commentary and charts-of-interest are designed to stimulate thinking. This analysis is
not a recommendation to buy, sell, hold or sell short any security (stock ETF or otherwise).
We all need to think for ourselves when it comes to trading our own accounts. First, it is
the only way to really learn. Second, we are the only ones responsible for our decisions.
Think of these charts as food for further analysis. Before making a trade, it is important
to have a plan. Plan the trade and trade the plan. Among other things, this includes setting
a trigger level, a target area and a stop-loss level. It is also important to plan for three
possible price movements: advance, decline or sideways. Have a plan for all three scenarios
BEFORE making the trade. Consider possible holding times. And finally, look at overall market
conditions and sector/industry performance.

About the author:
Arthur Hill, CMT, is the Chief Technical Strategist at TrendInvestorPro.com. Focusing predominantly on US equities and ETFs, his systematic approach of identifying trend, finding signals within the trend, and setting key price levels has made him an esteemed market technician. Arthur has written articles for numerous financial publications including Barrons and Stocks & Commodities Magazine. In addition to his Chartered Market Technician (CMT) designation, he holds an MBA from the Cass Business School at City University in London.
Learn More