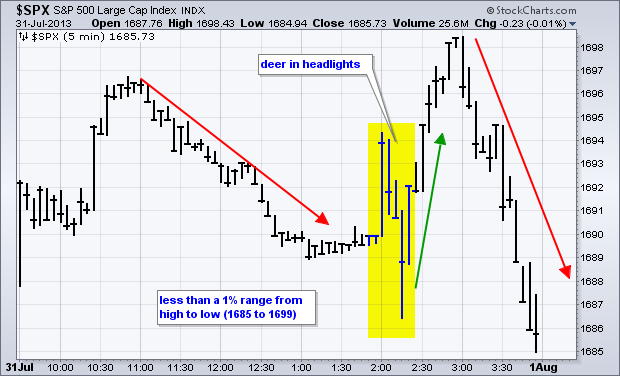
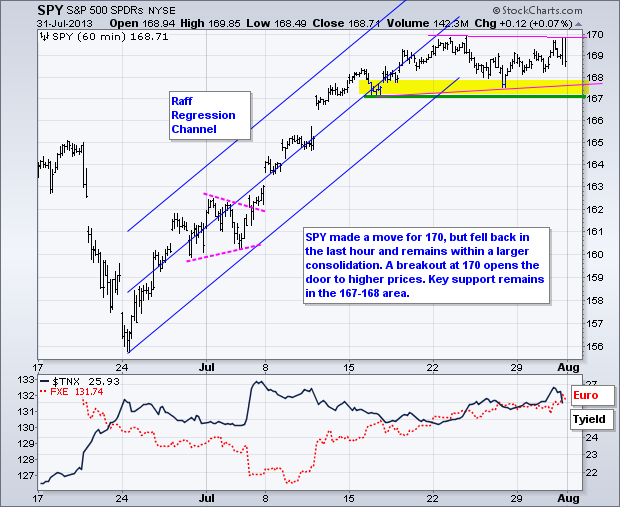
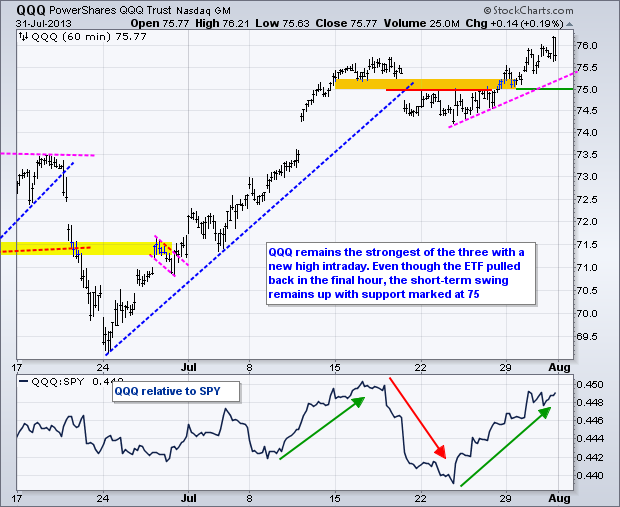
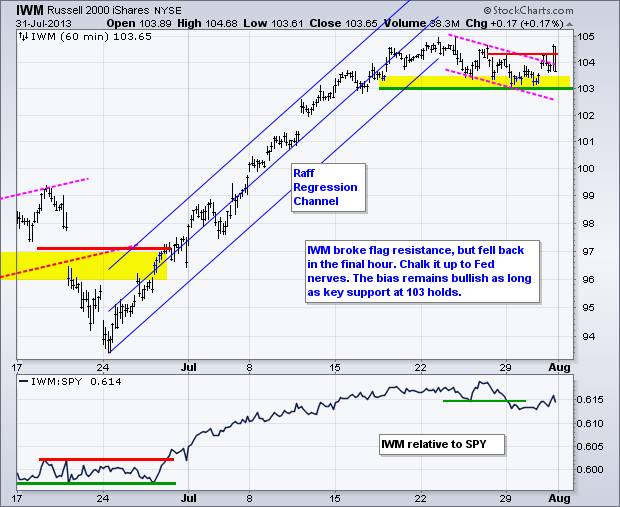
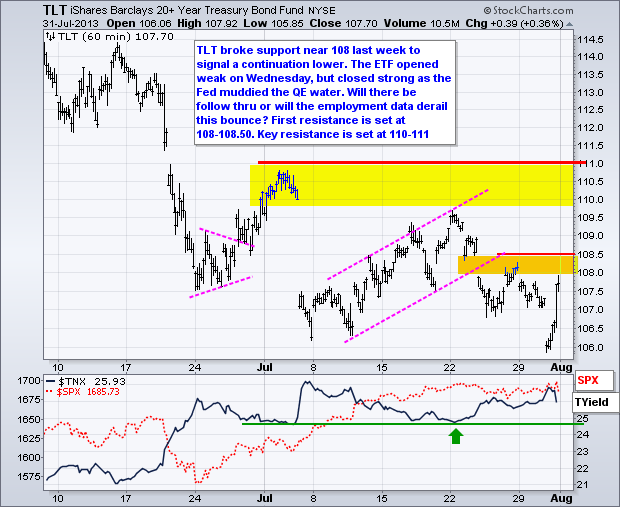
Stocks were all over the place on Wednesday, but the overall range was relatively small and the day-to-day change was miniscule. Stocks surged immediately after the Fed statement, peaked at 3PM and moved lower the final hour. I am not going to read too much into this late decline because trading is thin and we have two more days of data. Moreover, I would forget about the Fed statement and watch the economic data, which will ultimately determine the next Fed move. Overall, the economic data points are more positive than negative. This favors a move away from QE in the coming months. Less QE is not the same as tightening. No QE is also not the same as tightening. We are nowhere near the point where the Fed would actually consider tightening. Also keep in mind that the big trends are up and the lows of the last two weeks mark support for the major index ETFs. Even though the market stalled the last two weeks, we have yet to see any real selling pressure. Buying pressure may have diminished, but it is still stronger than selling pressure.

**************************************************************************
**************************************************************************
**************************************************************************
**************************************************************************
**************************************************************************
Key Reports and Events (all times Eastern):
Thu - Aug 01 - 07:30 - Challenger Job Cuts
Thu - Aug 01 - 08:30 - Jobless Claims
Thu - Aug 01 - 10:00 - ISM Index
Thu - Aug 01 - 10:00 - Construction Spending
Thu - Aug 01 - 10:30 - Natural Gas Inventories
Thu - Aug 01 - 14:00 - Auto Sales/Truck Sales
Fri - Aug 02 - 08:30 - Employment Report
Fri - Aug 02 - 08:30 - Personal Income & Spending
Fri - Aug 02 - 10:00 - Factory Orders
Charts of Interest: Tuesday and Thursday
This commentary and charts-of-interest are designed to stimulate thinking. This analysis is
not a recommendation to buy, sell, hold or sell short any security (stock ETF or otherwise).
We all need to think for ourselves when it comes to trading our own accounts. First, it is
the only way to really learn. Second, we are the only ones responsible for our decisions.
Think of these charts as food for further analysis. Before making a trade, it is important
to have a plan. Plan the trade and trade the plan. Among other things, this includes setting
a trigger level, a target area and a stop-loss level. It is also important to plan for three
possible price movements: advance, decline or sideways. Have a plan for all three scenarios
BEFORE making the trade. Consider possible holding times. And finally, look at overall market
conditions and sector/industry performance.

About the author:
Arthur Hill, CMT, is the Chief Technical Strategist at TrendInvestorPro.com. Focusing predominantly on US equities and ETFs, his systematic approach of identifying trend, finding signals within the trend, and setting key price levels has made him an esteemed market technician. Arthur has written articles for numerous financial publications including Barrons and Stocks & Commodities Magazine. In addition to his Chartered Market Technician (CMT) designation, he holds an MBA from the Cass Business School at City University in London.
Learn More