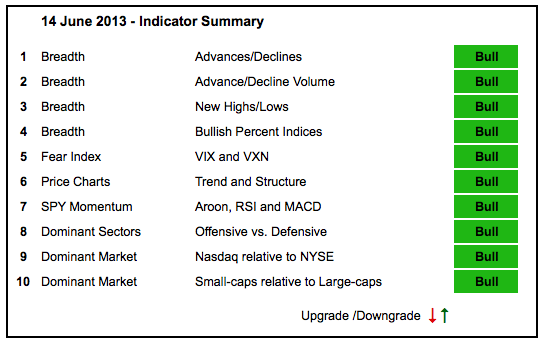
There is still no change in the indicator summary. Stocks corrected last four weeks and this correction weighed on the NYSE the most. The NYSE AD Line fell, but remains in an uptrend overall. NYSE Net New Highs turned negative for the first time since November. While I am concerned about this negative turn, Nasdaq Net New Highs remain positive and have yet to break down. Note that interest rate sensitive issues accounted for the majority of new lows in NYSE. SPY breadth indicators are at an interesting juncture as RSI firms in the 40-50 zone, which held in late December, late February and mid April.


- AD Lines: Bullish. The Nasdaq AD Line moved sideways the last four weeks with a flat consolidation. The NYSE AD Line fell as interest rate sensitive issues weighed. The overall trends for both remain up.
- AD Volume Lines: Bullish. The Nasdaq and NYSE AD Volume Lines pulled back over the last four weeks, but remain in uptrends since mid November.
- Net New Highs: Bullish. Nasdaq Net New Highs fell back over the last few weeks, but remained positive and the cumulative line held above its 10-day EMA. NYSE Net New Highs, however, turned negative and the cumulative line broke its 10-day EMA. The same thing happened in mid November. Let's see if this holds.
- Bullish Percent Indices: Bullish. All nine BPIs are above 50%.
- VIX/VXN: Bullish. The S&P 500 Volatility Index ($VIX) and the Nasdaq 100 Volatility Index ($VXN) moved higher from mid May to mid June, but remain below resistance from their February-April highs (±20).
- Trend-Structure: Bullish. DIA, IWM, MDY, QQQ and SPY hit 52-week highs in May and corrected the last four weeks. The short-term trends may be down, but the medium and long-term trends are still up.
- SPY Momentum: Bullish. RSI is firming in the 40-50 support zone. MACD(5,35,5) is below its signal line, but still above the zero line (positive). The Aroon Oscillator plunged to -50, but did not break -50 and flattened the last five days.
- Offensive Sector Performance: Bullish. XLF, XLI, XLK and XLY hit 52-week highs in May and then corrected over the last four weeks. These corrections have been relatively tame and these four still show some relative strength.
- Nasdaq Performance: Bullish. The $COMPQ:$NYC ratio broke out in May and has been moving higher the last six weeks.
- Small-cap Performance: Bullish. The $RUT:$OEX ratio bottomed in mid April and broke out in May. Small-caps have been outperforming since early May.
- Breadth Charts (here) and Intermarket Charts (here) have been updated.
This commentary and charts-of-interest are designed to stimulate thinking. This analysis is
not a recommendation to buy, sell, hold or sell short any security (stock ETF or otherwise).
We all need to think for ourselves when it comes to trading our own accounts. First, it is
the only way to really learn. Second, we are the only ones responsible for our decisions.
Think of these charts as food for further analysis. Before making a trade, it is important
to have a plan. Plan the trade and trade the plan. Among other things, this includes setting
a trigger level, a target area and a stop-loss level. It is also important to plan for three
possible price movements: advance, decline or sideways. Have a plan for all three scenarios
BEFORE making the trade. Consider possible holding times. And finally, look at overall market
conditions and sector/industry performance.

About the author:
Arthur Hill, CMT, is the Chief Technical Strategist at TrendInvestorPro.com. Focusing predominantly on US equities and ETFs, his systematic approach of identifying trend, finding signals within the trend, and setting key price levels has made him an esteemed market technician. Arthur has written articles for numerous financial publications including Barrons and Stocks & Commodities Magazine. In addition to his Chartered Market Technician (CMT) designation, he holds an MBA from the Cass Business School at City University in London.
Learn More