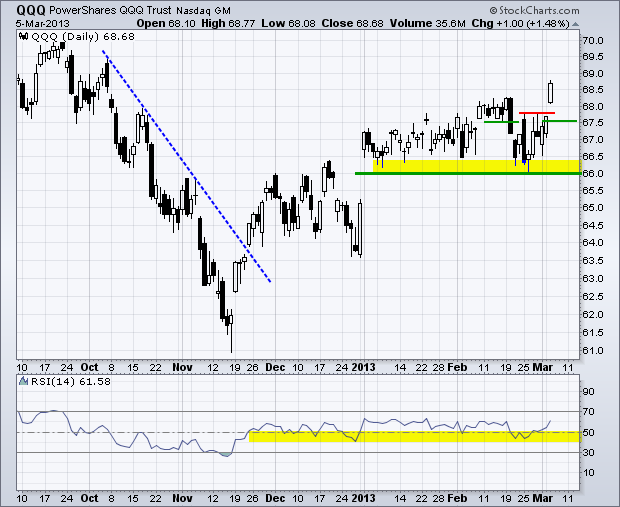
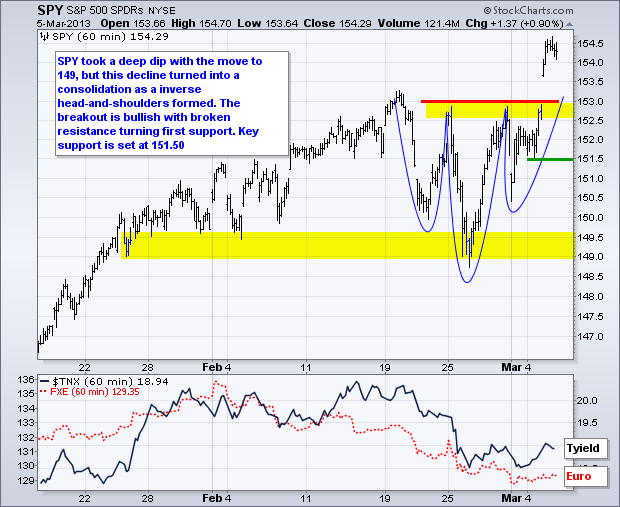
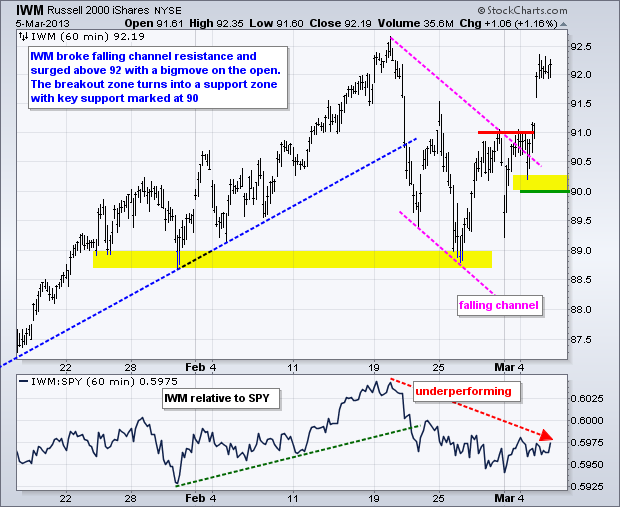
Stocks surged out of the gate with big gains in the first 30 minutes. The ISM Services Index beat expectations at 10AM and this kept the bid in stocks for the rest of the day. The major index ETFs finished the day with gains ranging from .90% for the Dow SPDR (DIA) to 1.48% for the Nasdaq 100 ETF (QQQ). Yes, QQQ led the day higher and finished above its February highs. It has been a sloppy and choppy uptrend for the year, but the trend has been up as the January 2nd gap held the entire time. Also notice that RSI held the 40-50 zone. Traders can argue about the reasons for the rally, but not the end result. There are still more buyers than sellers out there. Even though defensive sectors are performing well, don't forget that the Technology SPDR (XLK), Finance SPDR (XLF), Industrials SPDR (XLI) and Consumer Discretionary SPDR (XLY) hit new 2013 highs as well on Wednesday. The strong opens produced gaps and these gaps now hold the first short-term clue on the validity of these short-term uptrends. A strong gap should hold. A decline that fills the gap would be negative.

**************************************************************************
**************************************************************************
**************************************************************************
**************************************************************************
**************************************************************************
Key Reports and Events (all times Eastern):
Wed - Mar 06 - 07:00 - MBA Mortgage Index
Wed - Mar 06 - 08:15 - ADP Employment Change
Wed - Mar 06 - 10:00 - Factory Orders
Wed - Mar 06 - 10:30 - Crude Inventories
Wed - Mar 06 - 14:00 - Fed's Beige Book
Thu - Mar 07 - 08:30 - Initial Claims
Thu - Mar 07 - 08:30 - Continuing Claims
Thu - Mar 07 - 10:30 - Natural Gas Inventories
Thu - Mar 07 - 15:00 - Consumer Credit
Fri - Mar 08 - 08:30 - Nonfarm Payrolls
Fri - Mar 08 - 08:30 - Unemployment Rate
Wed – Mar 27 - 23:59 – Government Shut Down Deadline
Wed – May 15 - 23:59 – Debt Ceiling Deadline
Charts of Interest: Tuesday and Thursday
This commentary and charts-of-interest are designed to stimulate thinking. This analysis is
not a recommendation to buy, sell, hold or sell short any security (stock ETF or otherwise).
We all need to think for ourselves when it comes to trading our own accounts. First, it is
the only way to really learn. Second, we are the only ones responsible for our decisions.
Think of these charts as food for further analysis. Before making a trade, it is important
to have a plan. Plan the trade and trade the plan. Among other things, this includes setting
a trigger level, a target area and a stop-loss level. It is also important to plan for three
possible price movements: advance, decline or sideways. Have a plan for all three scenarios
BEFORE making the trade. Consider possible holding times. And finally, look at overall market
conditions and sector/industry performance.

About the author:
Arthur Hill, CMT, is the Chief Technical Strategist at TrendInvestorPro.com. Focusing predominantly on US equities and ETFs, his systematic approach of identifying trend, finding signals within the trend, and setting key price levels has made him an esteemed market technician. Arthur has written articles for numerous financial publications including Barrons and Stocks & Commodities Magazine. In addition to his Chartered Market Technician (CMT) designation, he holds an MBA from the Cass Business School at City University in London.
Learn More