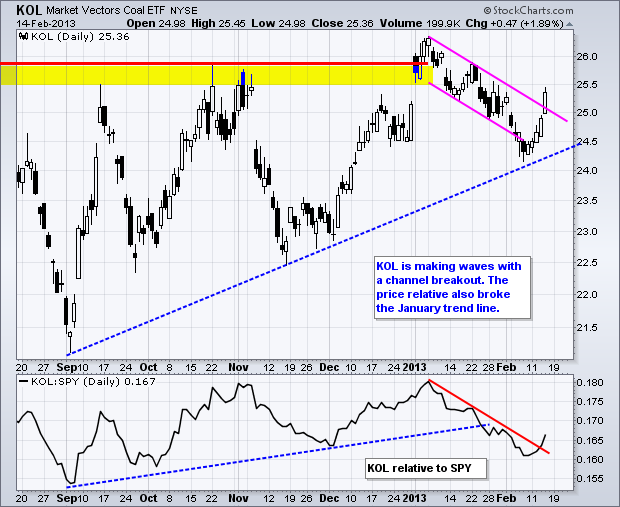
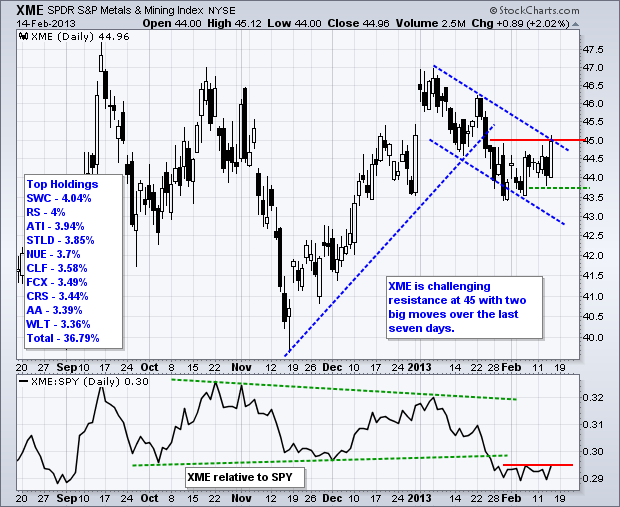
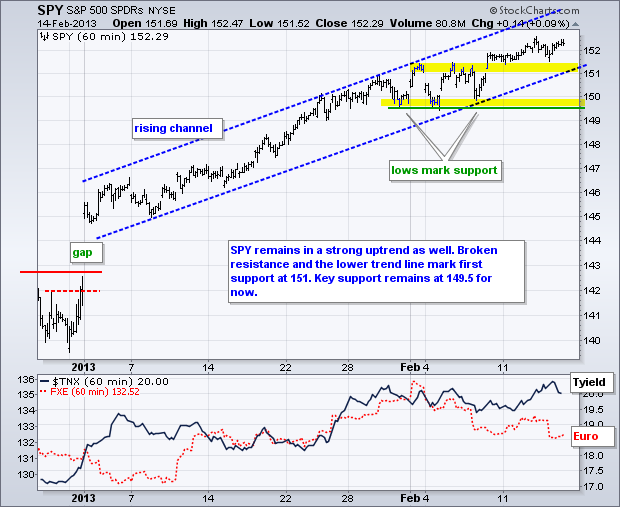
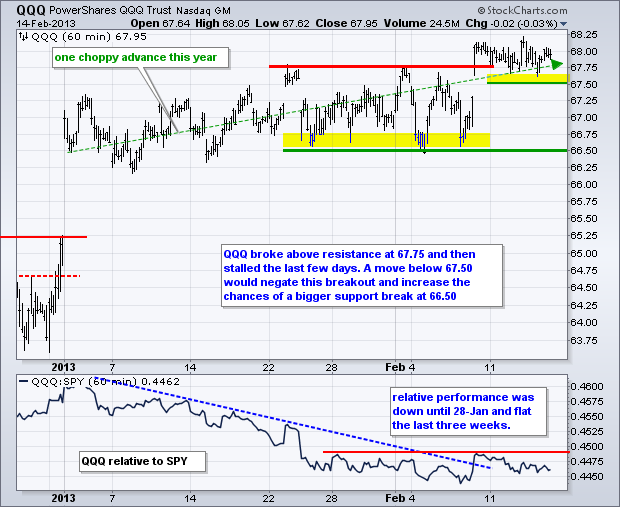
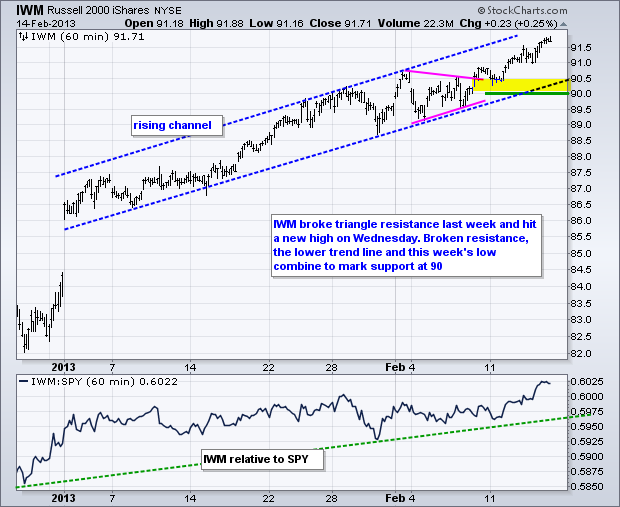
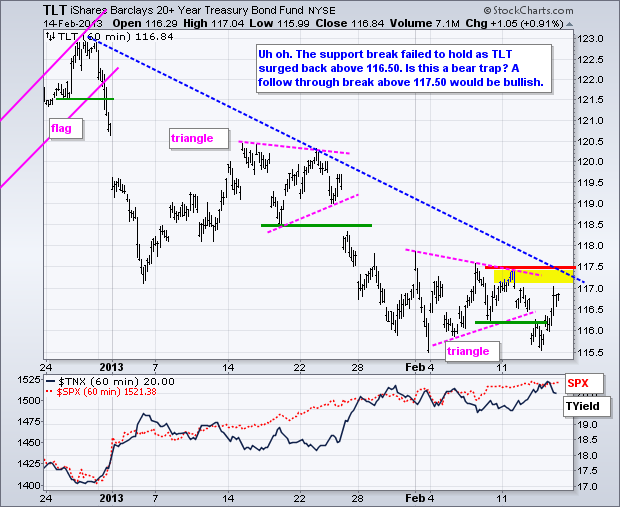
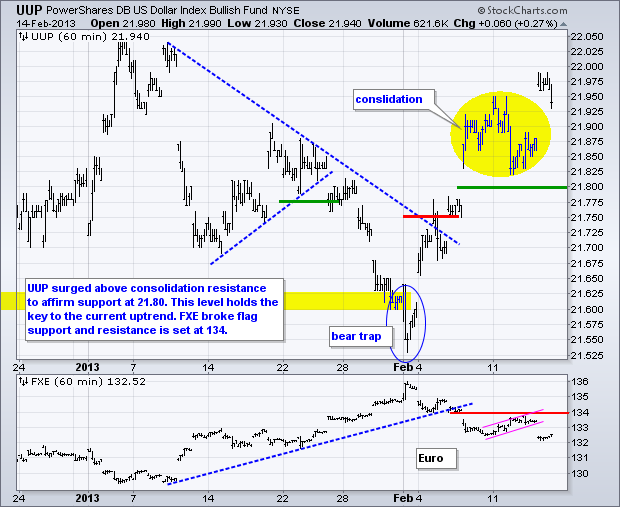
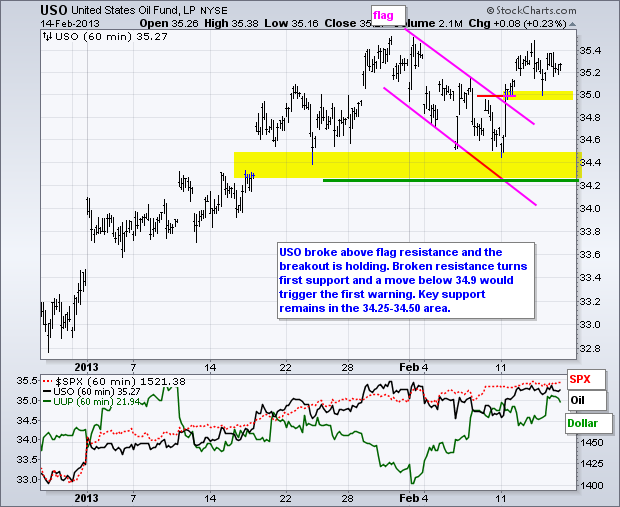
It was another mixed day overall,but the Russell 2000 ETF (IWM) edged to another 52-week high with a .25% gain. The ETF is now up seven of the last ten days this month. Even though the daily gains have been relatively small, IWM is up 3.08% since its 31-January. It is a stealthy advance that ignores overbought conditions. The sectors were also mixed with six up and three down. The Energy SPDR (XLE) led the way higher with a .86% gain. The remaining gains and losses were modest. Some beaten down groups got a lift on Thursday. The Coal Vectors ETF (KOL) surged 1.89% and the Metals & Mining SPDR (XME) advanced 2.02%. Oil services stocks were especially strong with the Oil & Gas Equipment/Services SPDR (XES) advancing 2.91% and hitting a new high. This could be because oil held up even as the Dollar surge and stocks meandered. Despite clear uptrends in SPY and IWM, I remain quite cautious on stocks for four reasons. First, treasuries are perking up as the 20+ Year T-Bond ETF (TLT) surged above its support break. Second, the Euro remains quite weak and this favors the risk-off trade. Third, stocks are overbought and ripe for a correction. Fourth, the Nasdaq 100 Equal-Weight ETF (QQEW) has been lagging SPY for three weeks now.
**************************************************************************
**************************************************************************
**************************************************************************
**************************************************************************
**************************************************************************
Key Reports and Events:
Fri - Feb 15 - 08:30 – Empire State Manufacturing
Fri - Feb 15 - 09:15 - Industrial Production/Utilization
Fri - Feb 15 - 09:55 - Michigan Sentiment
Sun - Feb 24 - 10:00 – Italian Parliamentary Elections
Fri – Mar 01 - 23:59 – Sequester Takes Effect (unless...)
Wed – Mar 27 - 23:59 – Government Shut Down Deadline
Wed – May 15 - 23:59 – New Debt Ceiling Deadline
Charts of Interest: Tuesday and Thursday
This commentary and charts-of-interest are designed to stimulate thinking. This analysis is
not a recommendation to buy, sell, hold or sell short any security (stock ETF or otherwise).
We all need to think for ourselves when it comes to trading our own accounts. First, it is
the only way to really learn. Second, we are the only ones responsible for our decisions.
Think of these charts as food for further analysis. Before making a trade, it is important
to have a plan. Plan the trade and trade the plan. Among other things, this includes setting
a trigger level, a target area and a stop-loss level. It is also important to plan for three
possible price movements: advance, decline or sideways. Have a plan for all three scenarios
BEFORE making the trade. Consider possible holding times. And finally, look at overall market
conditions and sector/industry performance.

