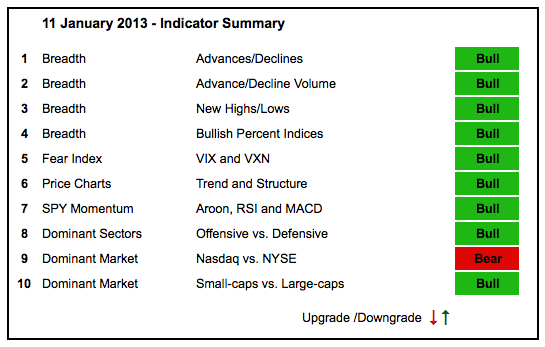
The vast majority of market indicators remain in bull mode. The Nasdaq AD Line broke above its
December high this week and the Nasdaq AD Volume Line broke above its September high. The Nasdaq
continues to lag the NY Composite, but tech stocks are starting to show a little life. Net New
Highs remain strong in both the Nasdaq and NYSE. Offensive sector performance is strong with
three of the four hitting 52-week highs this week. Stocks are getting overbought and earnings
season is just around the corner. These are the only potential negatives because stocks are
now priced for perfection.
It is once again time to address an ongoing issue with the indicator summary. As noted below
(every week), this indicator summary is NOT DESIGNED TO PICK TOPS OR BOTTOMS. Instead, it is
designed to assess current market conditions by applying a bullish, bearish or neutral rating
to 10 indicator groups. It seems, however, that the positive-negative total is sewing the seeds
of confusion. I will therefore cease totaling the summary and simply show the individual indicators
as bullish, bearish or neutral.
- AD Lines: Bullish. The Nasdaq AD Line broke the mid December high and March trend line to turn
bullish in early January. The NYSE AD Line hit a new high and remains in a strong uptrend. - AD Volume Lines: Bullish. The Nasdaq AD Volume Line broke above its September high and the
late December low marks key support. The NYSE AD Volume Line moved to a new high and
remains in a strong uptrend. - Net New Highs: Bullish. Nasdaq Net New Highs surged above 7.5% for the third time in 12 months
(early Feb-2012, mid Sep-2012 and early Jan-2013). NYSE net new highs surged above 15% this
week and the cumulative line hit a new high. - Bullish Percent Indices: Bullish. All nine sector Bullish Percent Indices are above 50%.
- VIX/VXN: Bullish. The Nasdaq 100 Volatility Index ($VXN) and S&P 500 Volatility Index ($VIX)
plunged this year and are both trading well below 20%. In fact, the VIX is below 15 and in a clear
downtrend. The fear factor is low and this is positive for stocks. - Trend-Structure: Bullish. IWM and MDY hit fresh 52-week highs this week. SPY and DIA are both
near 52-week highs. QQQ remains the laggard, but the QQEW is at a 52-week high. - SPY Momentum: Bullish. RSI held the 40-50 support zone in late December and surged.
MACD(5,35,5) remains in an uptrend and positive. Aroon surged above +50 in early December and
remains positive. - Offensive Sector Performance: Bullish. The Consumer Discretionary SPDR (XLY), Industrials SPDR
(XLI) and Finance SPDR (XLF) hit 52-week highs this week. Enough said. - Nasdaq Performance: Bearish. The $COMPQ:$NYA ratio bounced, but remains in a downtrend
since early September. Blame is on a few large cap tech stocks. - Small-cap Performance: Bullish. The $RUT:$OEX ratio hit a ten month high as small-caps
outperform large-caps. - Breadth Charts (here) and Inter-market charts (here) have been updated.
to pick tops or bottoms. Instead, it seeks to identify noticeable shifts in buying and selling pressure.

