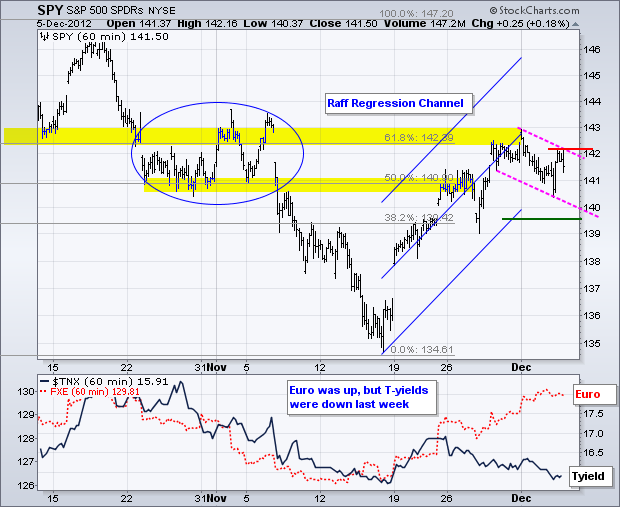
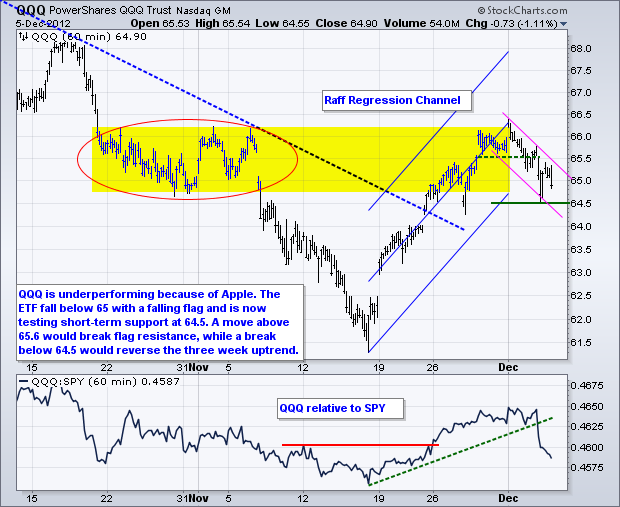
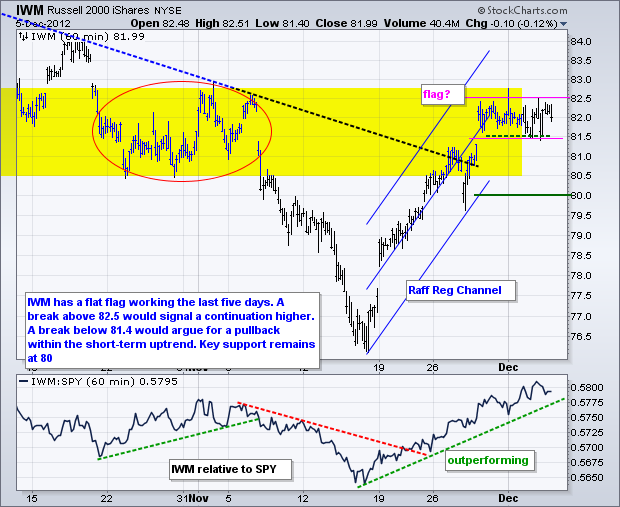
Stocks continued to drift on Wednesday with the major index ETFs finishing mixed. The Dow Industrials SPDR (DIA) advanced .66% as the Nasdaq 100 ETF (QQQ) plunged 1.11%. Apple led the way lower for QQQ. Note that the Nasdaq 100 Equal-Weight ETF (QQEW) was up .37% and it was not all that bad in techland. The sectors were also unusually mixed with industrials, finance and utilities surging over 1%. These gains were countered with losses in consumer discretionary, materials and technology. It is about as mixed as it can get. On the 60-minute chart, the S&P 500 ETF (SPY) surged above 142 last week and then consolidated the last five days. A falling flag of sorts may be taking shape with first resistance just above 142. A break above this level would argue for a continuation higher. With this falling flag, SPY has a mini-downswing working within the three week uptrend. Key support remains at 139.5 for this short-term uptrend.

**************************************************************************
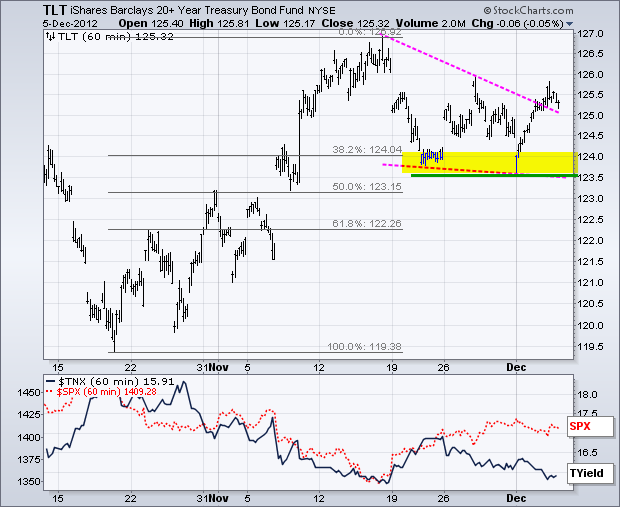
The 20+ Year T-Bond ETF (TLT) opened weak on Monday and then surged above the falling wedge trend line. This breakout is medium-term bullish because it signals a continuation of the prior advance (mid Oct to mid Nov). A breakout in TLT is negative for stocks, which are negatively correlated with treasuries. Traders must now brace for the reaction to Friday's employment report. A better-than-expected employment report would weight on treasuries, but a worse-than-expected number would be positive and extend the breakout.
**************************************************************************
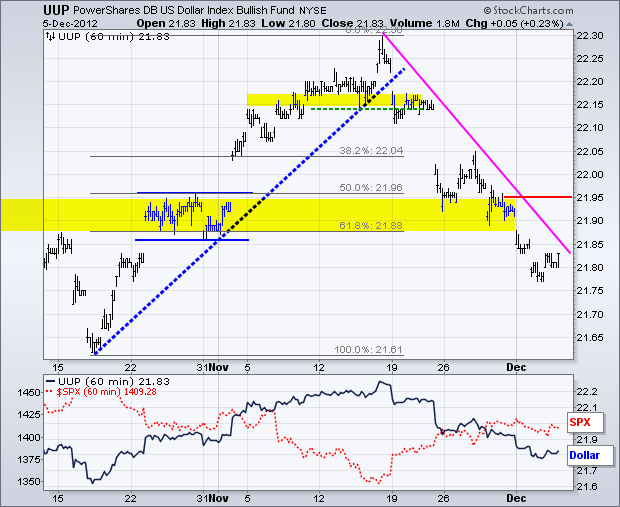
The US Dollar Fund (UUP) finally firmed somewhat on Wednesday, but remains in a downtrend overall. The European Central Bank (ECB) meets today and this could affect the Euro. Which way, however, is anyone's guess. UUP resistance is set at 21.95 and a break above this level would reverse the three week downtrend. Note that this downtrend coincides with an uptrend in stocks. An upside reversal in the Dollar would be bearish for stocks.
**************************************************************************
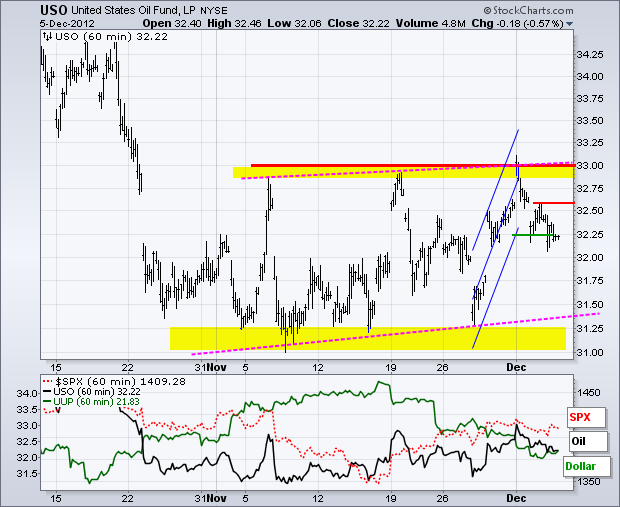
The US Oil Fund (USO) remains quite volatile within the rising consolidation, which has been rising since early November. This zigzag higher looks like a bearish flag on the daily chart. The swing within the zigzag turned down with a break below the Raff Regression Channel this week. I am setting first resistance at 32.6 and key resistance at 33.
**************************************************************************
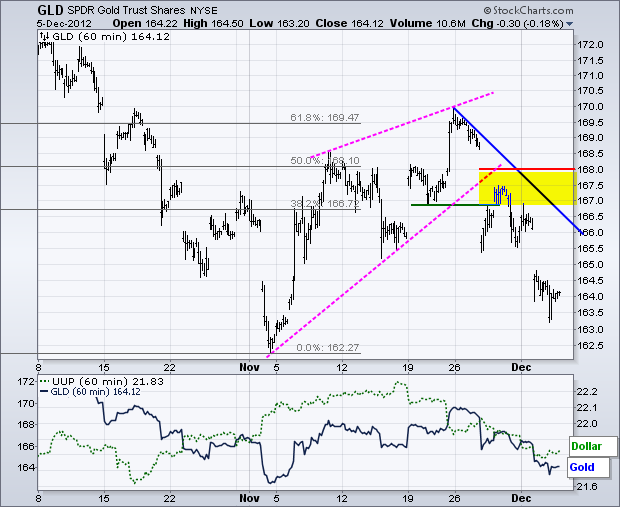
Who would have thought that both the Dollar and gold could sharply at the same time? This happened over the last five days as selling pressure hit gold hard. The Gold SPDR (GLD) broke wedge support with a sharp decline last week. There was a small throwback to broken support and then a continuation lower this week. There is nothing but downtrend on this chart. I am leaving key resistance at 168 for now.
**************************************************************************
Key Reports and Events:
Thu - Dec 06 - 07:30 - Challenger Job Cuts
Thu - Dec 06 - 08:30 - Jobless Claims
Fri - Dec 07 - 08:30 - Employment Report
Fri - Dec 07 - 09:55 - Michigan Sentiment
Charts of Interest: Tuesday and Thursday
This commentary and charts-of-interest are designed to stimulate thinking. This analysis is not a recommendation to buy, sell, hold or sell short any security (stock ETF or otherwise). We all need to think for ourselves when it comes to trading our own accounts. First, it is the only way to really learn. Second, we are the only ones responsible for our decisions. Think of these charts as food for further analysis. Before making a trade, it is important to have a plan. Plan the trade and trade the plan. Among other things, this includes setting a trigger level, a target area and a stop-loss level. It is also important to plan for three possible price movements: advance, decline or sideways. Have a plan for all three scenarios BEFORE making the trade. Consider possible holding times. And finally, look at overall market conditions and sector/industry performance.

**************************************************************************
The US Dollar Fund (UUP) finally firmed somewhat on Wednesday, but remains in a downtrend overall. The European Central Bank (ECB) meets today and this could affect the Euro. Which way, however, is anyone's guess. UUP resistance is set at 21.95 and a break above this level would reverse the three week downtrend. Note that this downtrend coincides with an uptrend in stocks. An upside reversal in the Dollar would be bearish for stocks.

**************************************************************************
The US Oil Fund (USO) remains quite volatile within the rising consolidation, which has been rising since early November. This zigzag higher looks like a bearish flag on the daily chart. The swing within the zigzag turned down with a break below the Raff Regression Channel this week. I am setting first resistance at 32.6 and key resistance at 33.

**************************************************************************
Who would have thought that both the Dollar and gold could sharply at the same time? This happened over the last five days as selling pressure hit gold hard. The Gold SPDR (GLD) broke wedge support with a sharp decline last week. There was a small throwback to broken support and then a continuation lower this week. There is nothing but downtrend on this chart. I am leaving key resistance at 168 for now.

**************************************************************************
Key Reports and Events:
Thu - Dec 06 - 07:30 - Challenger Job Cuts
Thu - Dec 06 - 08:30 - Jobless Claims
Fri - Dec 07 - 08:30 - Employment Report
Fri - Dec 07 - 09:55 - Michigan Sentiment
Charts of Interest: Tuesday and Thursday
This commentary and charts-of-interest are designed to stimulate thinking. This analysis is not a recommendation to buy, sell, hold or sell short any security (stock ETF or otherwise). We all need to think for ourselves when it comes to trading our own accounts. First, it is the only way to really learn. Second, we are the only ones responsible for our decisions. Think of these charts as food for further analysis. Before making a trade, it is important to have a plan. Plan the trade and trade the plan. Among other things, this includes setting a trigger level, a target area and a stop-loss level. It is also important to plan for three possible price movements: advance, decline or sideways. Have a plan for all three scenarios BEFORE making the trade. Consider possible holding times. And finally, look at overall market conditions and sector/industry performance.

About the author:
Arthur Hill, CMT, is the Chief Technical Strategist at TrendInvestorPro.com. Focusing predominantly on US equities and ETFs, his systematic approach of identifying trend, finding signals within the trend, and setting key price levels has made him an esteemed market technician. Arthur has written articles for numerous financial publications including Barrons and Stocks & Commodities Magazine. In addition to his Chartered Market Technician (CMT) designation, he holds an MBA from the Cass Business School at City University in London.
Learn More