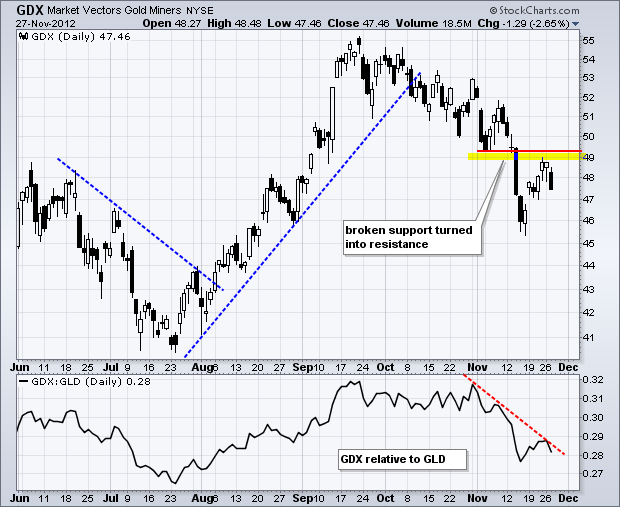
Stocks edged lower on Tuesday as the major index ETFs worked off short-term overbought conditions. Eight of the nine sectors were lower with the Finance SPDR (XLF) and Energy SPDR (XLE) leading the decline. Both lost around .90% on the day. The Utilities SPDR (XLU) bucked selling pressure with a modest gain. Of note, metals and mining issues remain under pressure as the Gold Miners ETF (GDX) fell 2.65%, the Metals & Mining SPDR (XME) fell 1.18% and the Steel ETF (SLX) declined 1.48%. The chart below shows GDX hitting resistance from broken support in the 49 area. Also notice that GDX is severely underperforming gold.
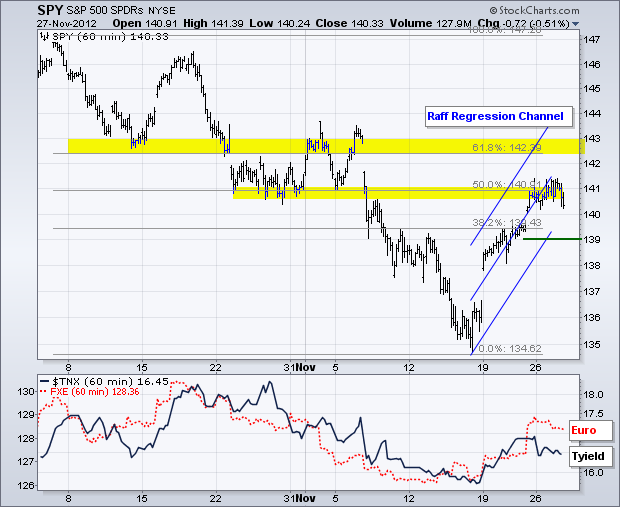
On the 60-minute chart, the S&P 500 ETF (SPY) hit resistance in the 141 area and edged lower on Tuesday. The bounce from 135 to 141 alleviated short-term oversold conditions and actually created short-term overbought conditions. There is also resistance in the 141 area from broken support and the 50% retracement line. The going is getting harder for the bulls now and chartists should be on guard for at least a pullback or consolidation. The blue lines mark a Raff Regression Channel extending up from the mid November low. Using the lower trend line and a small buffer, I am marking upswing support at 139.
**************************************************************************
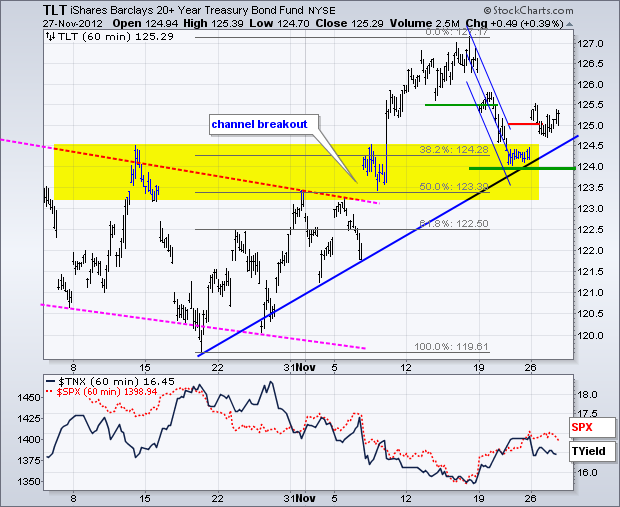
The 20+ Year T-Bond ETF (TLT) broke channel resistance in early November and corrected back to the breakout zone last week. The ETF broke Raff Regression Channel resistance at 125 with a surge on Monday and held its gains on Tuesday. It looks like the upswing is resuming here and I am marking key support at 124. Strength in treasuries would be negative for stocks and the Euro.
**************************************************************************
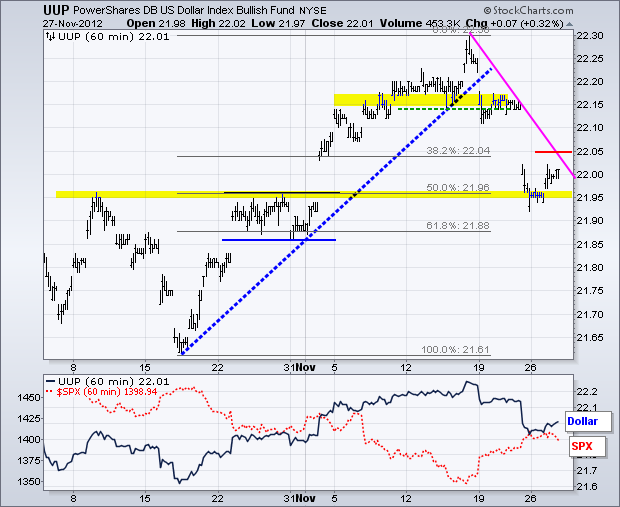
The US Dollar Fund (UUP) broke resistance with a big surge in early November and returned to the scene of the crime with the throwback last week. Broken resistance turned into support as the ETF bounced on Tuesday. Using the pink trend line and a buffer, I am marking downswing resistance at 22.05. A break above this level would reverse the downswing and signal a resumption of the bigger uptrend.
**************************************************************************
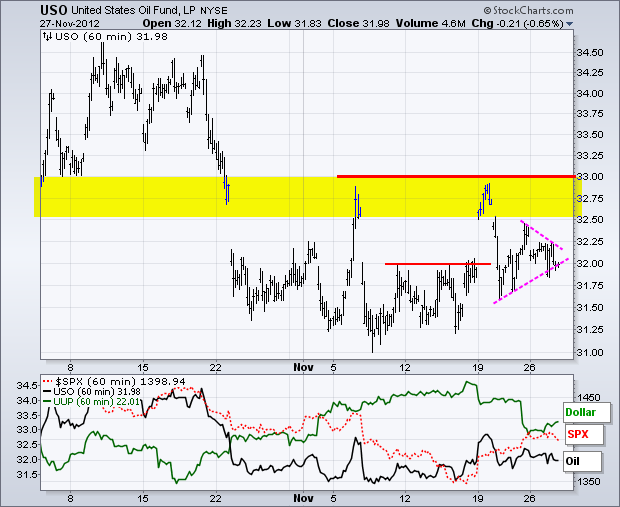
The US Oil Fund (USO) backed off resistance in the 33 area with a sharp decline last week and then consolidated with a triangle. The ETF is on the verge of breaking triangle support. A move below 31.75 would be short-term bearish and signal a continuation lower.
**************************************************************************
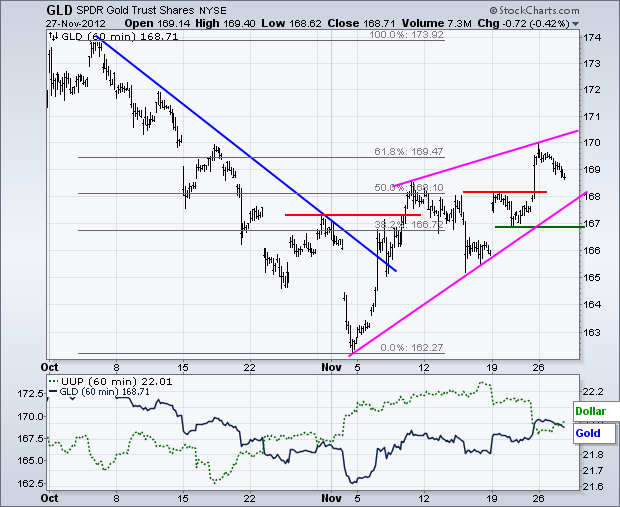
The Gold SPDR (GLD) remains in a short-term uptrend, but is running into resistance from the 61.80% retracement. A rising wedge defines this uptrend with support just below 167. A lot depends on the Dollar and stock market. Strength in the Dollar and weakness in stocks would weigh on gold.
**************************************************************************
Key Reports and Events:
Wed - Nov 28 - 07:00 - MBA Mortgage Index
Wed - Nov 28 - 10:00 - New Home Sales
Wed - Nov 28 - 10:30 - Oil Inventories
Wed - Nov 28 - 14:00 - Fed's Beige Book
Thu - Nov 29 - 08:30 - Jobless Claims
Thu - Nov 29 - 08:30 - GDP
Thu - Nov 29 - 10:00 - Pending Home Sales
Fri - Nov 30 - 08:30 - Personal Income/Spending
Fri - Nov 30 - 09:45 - Chicago PMI
Charts of Interest: Tuesday and Thursday
This commentary and charts-of-interest are designed to stimulate thinking. This analysis is not a recommendation to buy, sell, hold or sell short any security (stock ETF or otherwise). We all need to think for ourselves when it comes to trading our own accounts. First, it is the only way to really learn. Second, we are the only ones responsible for our decisions. Think of these charts as food for further analysis. Before making a trade, it is important to have a plan. Plan the trade and trade the plan. Among other things, this includes setting a trigger level, a target area and a stop-loss level. It is also important to plan for three possible price movements: advance, decline or sideways. Have a plan for all three scenarios BEFORE making the trade. Consider possible holding times. And finally, look at overall market conditions and sector/industry performance.


**************************************************************************
The 20+ Year T-Bond ETF (TLT) broke channel resistance in early November and corrected back to the breakout zone last week. The ETF broke Raff Regression Channel resistance at 125 with a surge on Monday and held its gains on Tuesday. It looks like the upswing is resuming here and I am marking key support at 124. Strength in treasuries would be negative for stocks and the Euro.

**************************************************************************
The US Dollar Fund (UUP) broke resistance with a big surge in early November and returned to the scene of the crime with the throwback last week. Broken resistance turned into support as the ETF bounced on Tuesday. Using the pink trend line and a buffer, I am marking downswing resistance at 22.05. A break above this level would reverse the downswing and signal a resumption of the bigger uptrend.

**************************************************************************
The US Oil Fund (USO) backed off resistance in the 33 area with a sharp decline last week and then consolidated with a triangle. The ETF is on the verge of breaking triangle support. A move below 31.75 would be short-term bearish and signal a continuation lower.

**************************************************************************
The Gold SPDR (GLD) remains in a short-term uptrend, but is running into resistance from the 61.80% retracement. A rising wedge defines this uptrend with support just below 167. A lot depends on the Dollar and stock market. Strength in the Dollar and weakness in stocks would weigh on gold.

**************************************************************************
Key Reports and Events:
Wed - Nov 28 - 07:00 - MBA Mortgage Index
Wed - Nov 28 - 10:00 - New Home Sales
Wed - Nov 28 - 10:30 - Oil Inventories
Wed - Nov 28 - 14:00 - Fed's Beige Book
Thu - Nov 29 - 08:30 - Jobless Claims
Thu - Nov 29 - 08:30 - GDP
Thu - Nov 29 - 10:00 - Pending Home Sales
Fri - Nov 30 - 08:30 - Personal Income/Spending
Fri - Nov 30 - 09:45 - Chicago PMI
Charts of Interest: Tuesday and Thursday
This commentary and charts-of-interest are designed to stimulate thinking. This analysis is not a recommendation to buy, sell, hold or sell short any security (stock ETF or otherwise). We all need to think for ourselves when it comes to trading our own accounts. First, it is the only way to really learn. Second, we are the only ones responsible for our decisions. Think of these charts as food for further analysis. Before making a trade, it is important to have a plan. Plan the trade and trade the plan. Among other things, this includes setting a trigger level, a target area and a stop-loss level. It is also important to plan for three possible price movements: advance, decline or sideways. Have a plan for all three scenarios BEFORE making the trade. Consider possible holding times. And finally, look at overall market conditions and sector/industry performance.

About the author:
Arthur Hill, CMT, is the Chief Technical Strategist at TrendInvestorPro.com. Focusing predominantly on US equities and ETFs, his systematic approach of identifying trend, finding signals within the trend, and setting key price levels has made him an esteemed market technician. Arthur has written articles for numerous financial publications including Barrons and Stocks & Commodities Magazine. In addition to his Chartered Market Technician (CMT) designation, he holds an MBA from the Cass Business School at City University in London.
Learn More
