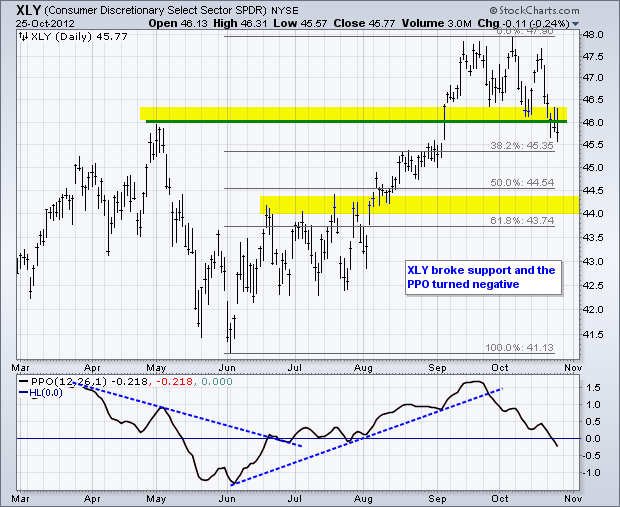
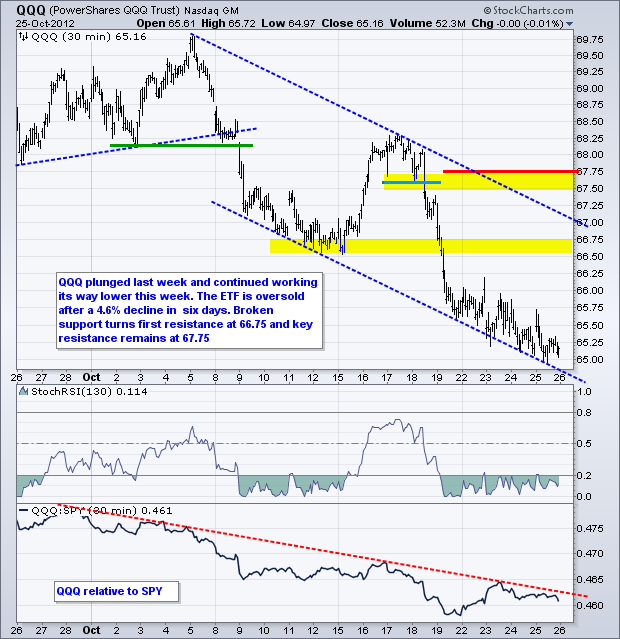
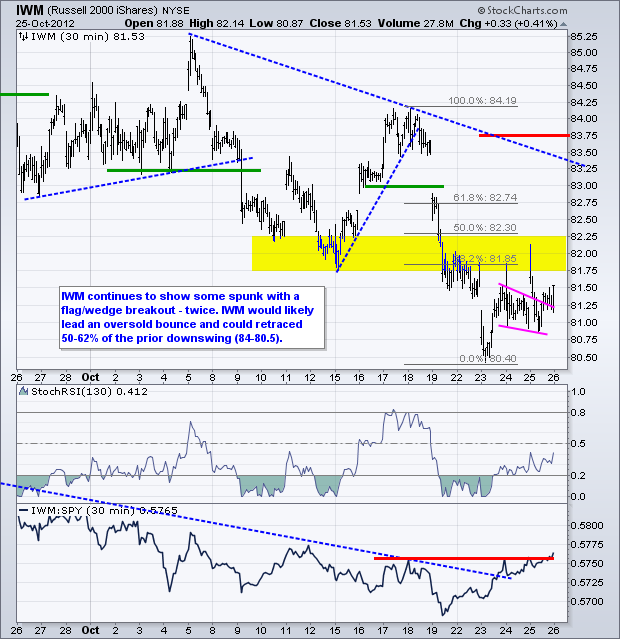
Stocks managed to eek out small gains on Thursday as the Russell 2000 ETF (IWM) advanced .41% and the Nasdaq 100 Equal-Weight ETF (QQEW) added .52%. Note, however, that the Nasdaq 100 ETF (QQQ) closed down a fraction (.01%). Stocks were under selling pressure after the close as Amazon and Apple disappointed on both the third quarter and their outlooks. It looks like we have a real tablet war on our hands now (iPad, Surface, Galaxy, Kindle, Nook...). The Consumer Discretionary SPDR (XLY) and the Technology SPDR (XLK) also edged lower. The Home Construction iShares (ITB) led the consumer discretionary lower, while the Networking iShares (IGN) led the technology sector lower. Wall Street will no doubt be happy when third quarter earnings season ends because it has been a big disappointment. Unfortunately, Wall Street can then turn its attention to the election and the fiscal cliff.

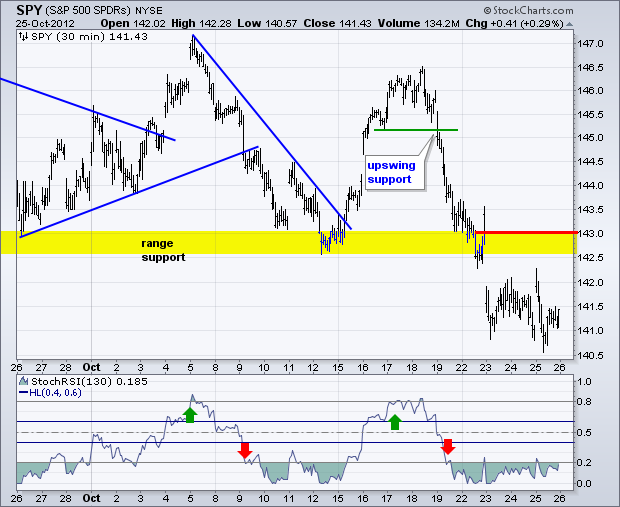
Trading was quite erratic on Thursday as SPY surged above 142 on the open, plunged below 141 and then settled in the 141.5 area. The ETF is basically consolidating in oversold territory. We could still see an oversold bounce, but this would be considered a counter-trend move. Broken support turns first resistance in the 142.5-143 area.
**************************************************************************
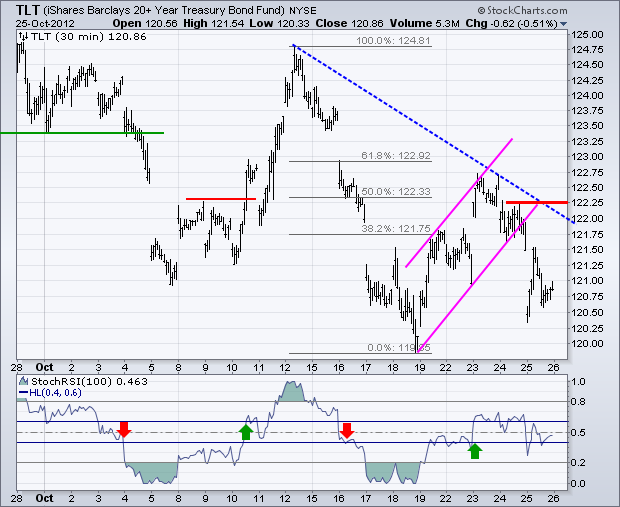
No change. The 20+ Year T-Bond ETF (TLT) is in a medium-term downtrend since late July and a short-term downtrend since the late September peak. The decline since late September has been very choppy with sharp reaction rallies and even sharper declines. TLT surged as stocks fell, but then fell back the last three days. At this point, I am tempted to go with the bigger downtrends. This means the failure in the 50-61.80% retracement zone and the rising channel break are bearish. First resistance is at 122.25
**************************************************************************
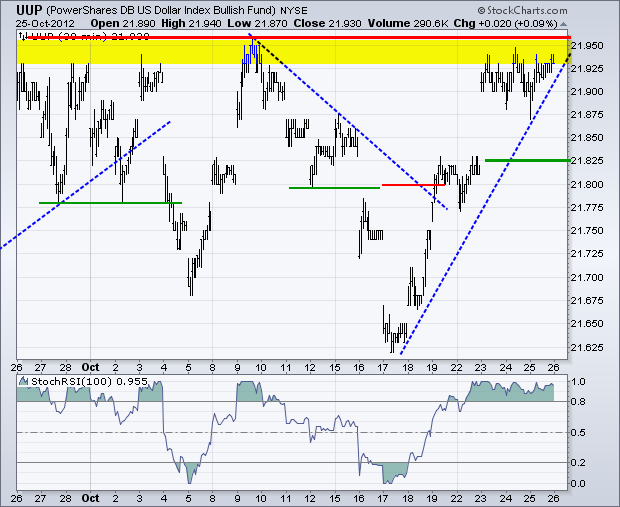
No change. The US Dollar Fund (UUP) is consolidating at resistance from the October highs, which marks a key make-or-break level. A breakout here would be quite bullish and signal a move towards the risk-off trade. Failure at resistance and a downturn would signal a move towards risk-on. I am going to add a little buffer and set upswing support at 21.825.
**************************************************************************
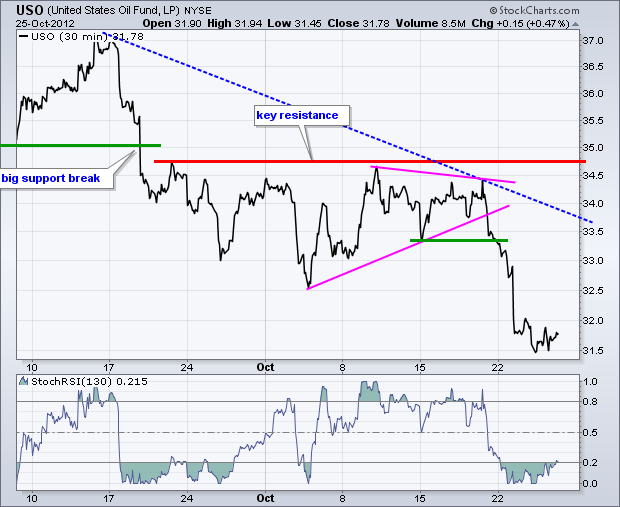
No change. The US Oil Fund (USO) broke down in mid September and held this breakdown as broken support turned into resistance. With a sharp decline the last three days, USO broke short-term support from last week's low to signal a continuation lower. This breakdown further reinforces resistance in the 34.5-34.75 area.
**************************************************************************
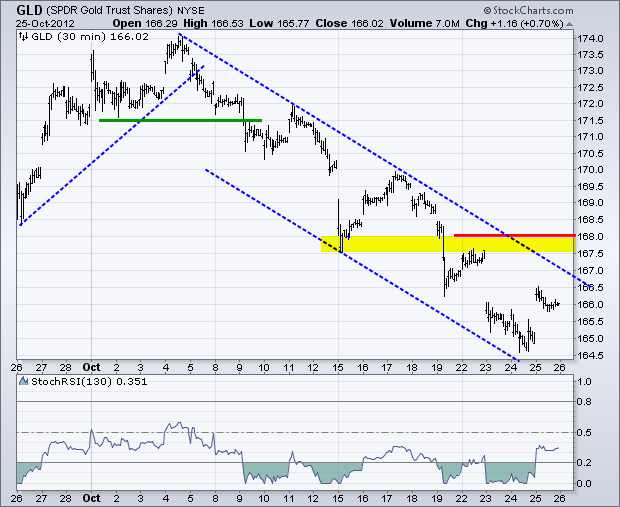
The Gold SPDR (GLD) got an oversold bounce on Thursday, even as stocks remained soft and the Dollar hugged resistance. The ETF remains within a falling channel and clear downtrend though. I am lowering key resistance to 168. This level stems from broken support. A move above 168 would break the channel and exceed Monday's high. This would be enough to reverse the three week downtrend.
**************************************************************************
Key Reports and Events:
Fri - Oct 26 - 08:30 - GDP
Fri - Oct 26 - 09:55 - Michigan Sentiment
Charts of Interest: Tuesday and Thursday
This commentary and charts-of-interest are designed to stimulate thinking. This analysis is not a recommendation to buy, sell, hold or sell short any security (stock ETF or otherwise). We all need to think for ourselves when it comes to trading our own accounts. First, it is the only way to really learn. Second, we are the only ones responsible for our decisions. Think of these charts as food for further analysis. Before making a trade, it is important to have a plan. Plan the trade and trade the plan. Among other things, this includes setting a trigger level, a target area and a stop-loss level. It is also important to plan for three possible price movements: advance, decline or sideways. Have a plan for all three scenarios BEFORE making the trade. Consider possible holding times. And finally, look at overall market conditions and sector/industry performance.


**************************************************************************
No change. The 20+ Year T-Bond ETF (TLT) is in a medium-term downtrend since late July and a short-term downtrend since the late September peak. The decline since late September has been very choppy with sharp reaction rallies and even sharper declines. TLT surged as stocks fell, but then fell back the last three days. At this point, I am tempted to go with the bigger downtrends. This means the failure in the 50-61.80% retracement zone and the rising channel break are bearish. First resistance is at 122.25

**************************************************************************
No change. The US Dollar Fund (UUP) is consolidating at resistance from the October highs, which marks a key make-or-break level. A breakout here would be quite bullish and signal a move towards the risk-off trade. Failure at resistance and a downturn would signal a move towards risk-on. I am going to add a little buffer and set upswing support at 21.825.

**************************************************************************
No change. The US Oil Fund (USO) broke down in mid September and held this breakdown as broken support turned into resistance. With a sharp decline the last three days, USO broke short-term support from last week's low to signal a continuation lower. This breakdown further reinforces resistance in the 34.5-34.75 area.

**************************************************************************
The Gold SPDR (GLD) got an oversold bounce on Thursday, even as stocks remained soft and the Dollar hugged resistance. The ETF remains within a falling channel and clear downtrend though. I am lowering key resistance to 168. This level stems from broken support. A move above 168 would break the channel and exceed Monday's high. This would be enough to reverse the three week downtrend.

**************************************************************************
Key Reports and Events:
Fri - Oct 26 - 08:30 - GDP
Fri - Oct 26 - 09:55 - Michigan Sentiment
Charts of Interest: Tuesday and Thursday
This commentary and charts-of-interest are designed to stimulate thinking. This analysis is not a recommendation to buy, sell, hold or sell short any security (stock ETF or otherwise). We all need to think for ourselves when it comes to trading our own accounts. First, it is the only way to really learn. Second, we are the only ones responsible for our decisions. Think of these charts as food for further analysis. Before making a trade, it is important to have a plan. Plan the trade and trade the plan. Among other things, this includes setting a trigger level, a target area and a stop-loss level. It is also important to plan for three possible price movements: advance, decline or sideways. Have a plan for all three scenarios BEFORE making the trade. Consider possible holding times. And finally, look at overall market conditions and sector/industry performance.

About the author:
Arthur Hill, CMT, is the Chief Technical Strategist at TrendInvestorPro.com. Focusing predominantly on US equities and ETFs, his systematic approach of identifying trend, finding signals within the trend, and setting key price levels has made him an esteemed market technician. Arthur has written articles for numerous financial publications including Barrons and Stocks & Commodities Magazine. In addition to his Chartered Market Technician (CMT) designation, he holds an MBA from the Cass Business School at City University in London.
Learn More