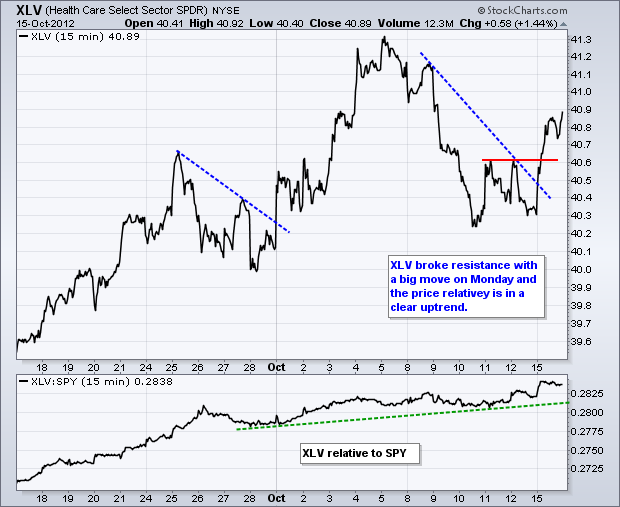
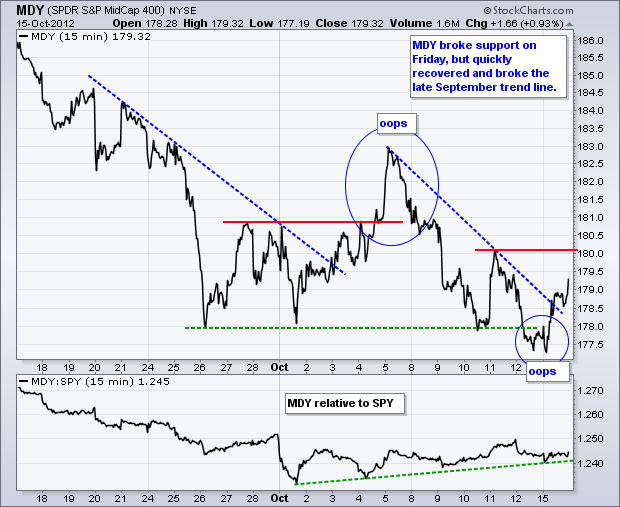
Stocks got an oversold bounce on Monday with the S&P MidCap 400 SPDR (MDY) leading the charge. Mid-caps occupy a certain sweet spot in the market because they are not too big and not too small. All nine sectors moved higher with the Healthcare SPDR (XLV) and Finance SPDR (XLF) advancing over 1%. Healthcare and finance continue to show relative strength and lead the market. XLF was buoyed by strong earnings from Citigroup. XLV was boosted with big gains in Merck, Pfizer and Eli Lilly, all of which are trading near 52-week highs.

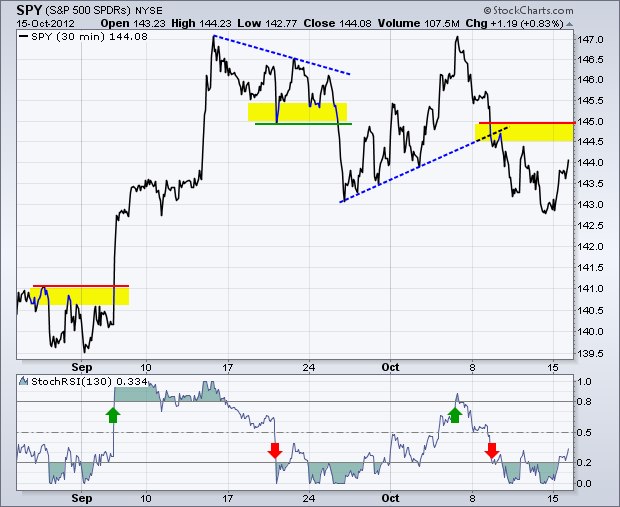
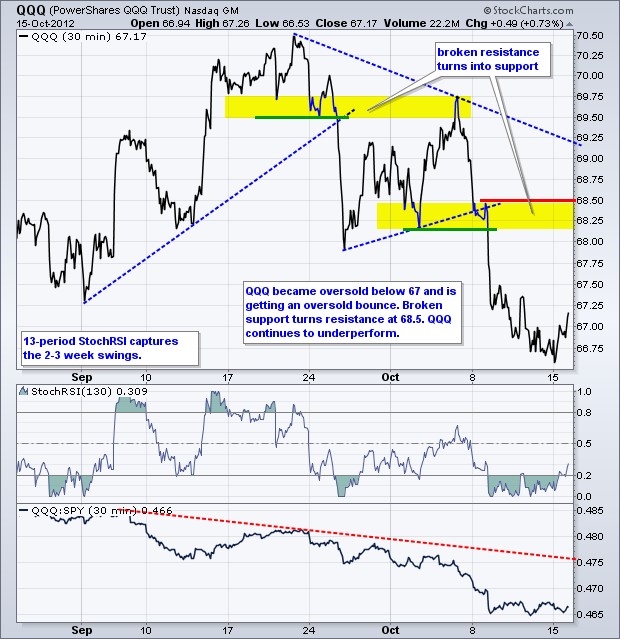
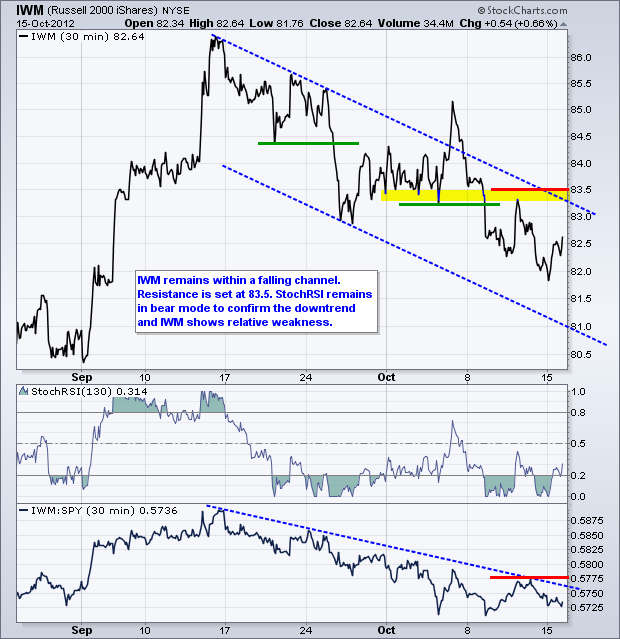
I am going to mix things up a bit on the intraday charts. Instead of 60-minute bar charts, I am going to show 30-minute line (close) charts with a 130-period StochRSI. I chose 65 to capture two-week momentum. There are thirteen 30-minute bars in a day and five days in a week (13 x 5 x 2 = 130). A move above .80 is deemed bullish and a move below .20 is deemed bearish. As with all indicator signals, these should be confirmed with a signal or pattern on the price chart. SPY broke support in the 144.5 area last week and StochRSI moved below .20 to turn bearish. SPY is getting an oversold bounce at this stage. Key resistance is set at 145.
**************************************************************************
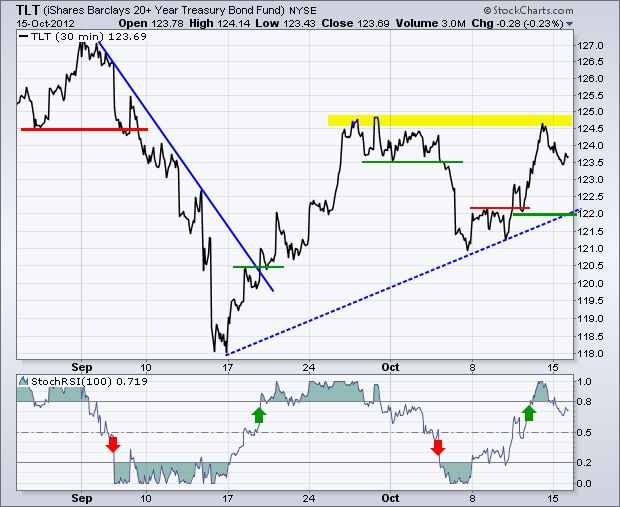
The 20+ Year T-Bond ETF (TLT) is a little less volatile than SPY so I am setting StochRSI at 100 periods. On this 30-minute chart, TLT broke resistance with a surge last week and the breakout is holding. Broken resistance and the mid September trend line now mark support at 122. A break below this level and a StochRSI move below .20 would reverse the short-term uptrend. TLT is hitting some resistance from the September highs. A break above these highs would be quite bullish and weigh negatively on stocks.
**************************************************************************
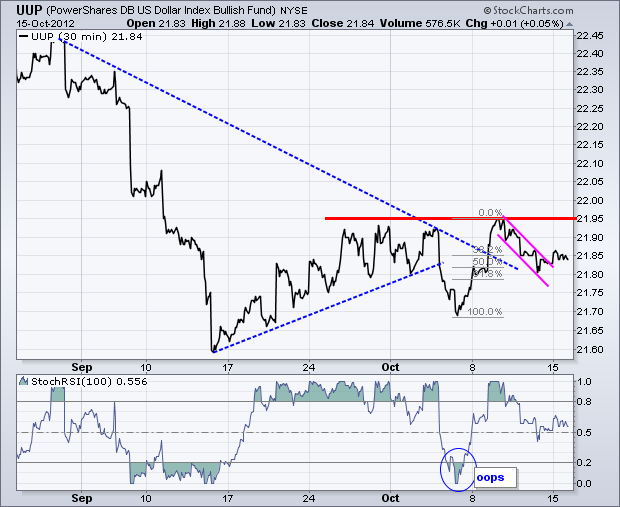
On the 30-minute chart, the US Dollar Fund (UUP) appeared to break down the first week of October, but quickly recovered with a surge to resistance. A falling flag formed last week and USO broke the flag trend line with a sideways move this week. Not sure how valid that breakout is. Overall, the ETF needs to clear resistance from last week's high to fully reverse the short-term downtrend. StochRSI shows signs of life with a surge above .80 last week. We now need follow through on the price chart.
**************************************************************************
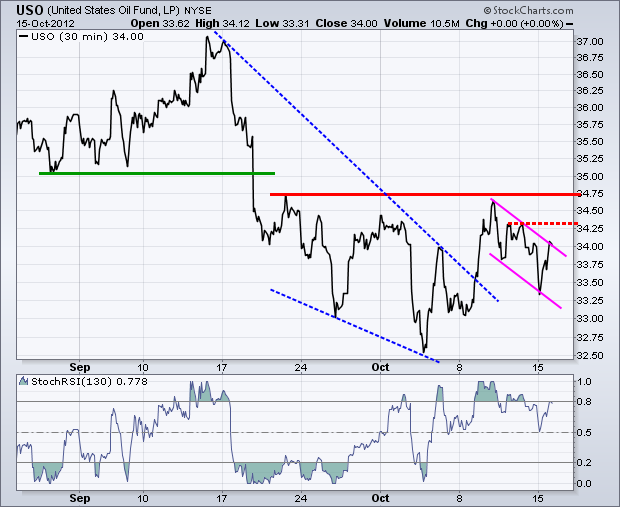
The US Oil Fund (USO) broke down in mid September and then moved into a volatile range. A falling wedge formed (blue trend lines) and the ETF broke this wedge trend line. However, USO met resistance at 34.75 and pulled back the last few days. A falling flag could be taking shape with first resistance at 34.35. StochRSI suggest a bullish momentum turn with the surge above .80. Follow through on the price chart would turn USO bullish again.
**************************************************************************
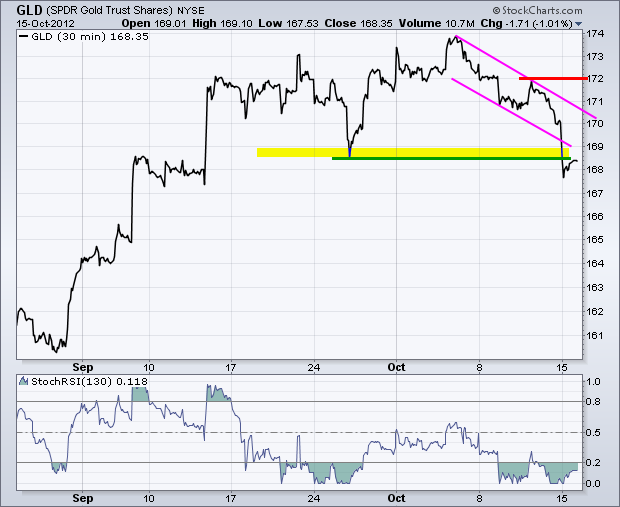
The Gold SPDR (GLD) plunged below support with a sharp decline on Monday. This is a tricky time for gold because it is trading near resistance on a one year timeframe and Euro/Dollar will be in focus with the EU Summit later this week. The support break suggests that gold is entering a correction that could retrace a portion of the prior advance (150 to 174). A 50% retracement would extend to the 162 area.
**************************************************************************
Key Reports and Events:
Tue - Oct 16 - 08:30 – Consumer Price Index (CPI)
Tue - Oct 16 - 09:15 - Industrial Production
Tue - Oct 16 - 10:00 - NAHB Housing Market Index
Wed - Oct 17 - 07:00 - MBA Mortgage Index
Wed - Oct 17 - 08:30 - Housing Starts/Building Permits
Wed - Oct 17 - 10:30 - Oil Inventories
Thu - Oct 18 - 08:30 - Jobless Claims
Thu – Oct 18 – 09:00 – EU Summit
Thu - Oct 18 - 10:00 - Philadelphia Fed
Thu - Oct 18 - 10:00 - Leading Indicators
Fri – Oct 19 – 09:00 – EU Summit
Fri - Oct 19 - 10:00 - Existing Home Sales
Charts of Interest: Tuesday and Thursday
This commentary and charts-of-interest are designed to stimulate thinking. This analysis is not a recommendation to buy, sell, hold or sell short any security (stock ETF or otherwise). We all need to think for ourselves when it comes to trading our own accounts. First, it is the only way to really learn. Second, we are the only ones responsible for our decisions. Think of these charts as food for further analysis. Before making a trade, it is important to have a plan. Plan the trade and trade the plan. Among other things, this includes setting a trigger level, a target area and a stop-loss level. It is also important to plan for three possible price movements: advance, decline or sideways. Have a plan for all three scenarios BEFORE making the trade. Consider possible holding times. And finally, look at overall market conditions and sector/industry performance.


**************************************************************************
The 20+ Year T-Bond ETF (TLT) is a little less volatile than SPY so I am setting StochRSI at 100 periods. On this 30-minute chart, TLT broke resistance with a surge last week and the breakout is holding. Broken resistance and the mid September trend line now mark support at 122. A break below this level and a StochRSI move below .20 would reverse the short-term uptrend. TLT is hitting some resistance from the September highs. A break above these highs would be quite bullish and weigh negatively on stocks.

**************************************************************************
On the 30-minute chart, the US Dollar Fund (UUP) appeared to break down the first week of October, but quickly recovered with a surge to resistance. A falling flag formed last week and USO broke the flag trend line with a sideways move this week. Not sure how valid that breakout is. Overall, the ETF needs to clear resistance from last week's high to fully reverse the short-term downtrend. StochRSI shows signs of life with a surge above .80 last week. We now need follow through on the price chart.

**************************************************************************
The US Oil Fund (USO) broke down in mid September and then moved into a volatile range. A falling wedge formed (blue trend lines) and the ETF broke this wedge trend line. However, USO met resistance at 34.75 and pulled back the last few days. A falling flag could be taking shape with first resistance at 34.35. StochRSI suggest a bullish momentum turn with the surge above .80. Follow through on the price chart would turn USO bullish again.

**************************************************************************
The Gold SPDR (GLD) plunged below support with a sharp decline on Monday. This is a tricky time for gold because it is trading near resistance on a one year timeframe and Euro/Dollar will be in focus with the EU Summit later this week. The support break suggests that gold is entering a correction that could retrace a portion of the prior advance (150 to 174). A 50% retracement would extend to the 162 area.

**************************************************************************
Key Reports and Events:
Tue - Oct 16 - 08:30 – Consumer Price Index (CPI)
Tue - Oct 16 - 09:15 - Industrial Production
Tue - Oct 16 - 10:00 - NAHB Housing Market Index
Wed - Oct 17 - 07:00 - MBA Mortgage Index
Wed - Oct 17 - 08:30 - Housing Starts/Building Permits
Wed - Oct 17 - 10:30 - Oil Inventories
Thu - Oct 18 - 08:30 - Jobless Claims
Thu – Oct 18 – 09:00 – EU Summit
Thu - Oct 18 - 10:00 - Philadelphia Fed
Thu - Oct 18 - 10:00 - Leading Indicators
Fri – Oct 19 – 09:00 – EU Summit
Fri - Oct 19 - 10:00 - Existing Home Sales
Charts of Interest: Tuesday and Thursday
This commentary and charts-of-interest are designed to stimulate thinking. This analysis is not a recommendation to buy, sell, hold or sell short any security (stock ETF or otherwise). We all need to think for ourselves when it comes to trading our own accounts. First, it is the only way to really learn. Second, we are the only ones responsible for our decisions. Think of these charts as food for further analysis. Before making a trade, it is important to have a plan. Plan the trade and trade the plan. Among other things, this includes setting a trigger level, a target area and a stop-loss level. It is also important to plan for three possible price movements: advance, decline or sideways. Have a plan for all three scenarios BEFORE making the trade. Consider possible holding times. And finally, look at overall market conditions and sector/industry performance.

About the author:
Arthur Hill, CMT, is the Chief Technical Strategist at TrendInvestorPro.com. Focusing predominantly on US equities and ETFs, his systematic approach of identifying trend, finding signals within the trend, and setting key price levels has made him an esteemed market technician. Arthur has written articles for numerous financial publications including Barrons and Stocks & Commodities Magazine. In addition to his Chartered Market Technician (CMT) designation, he holds an MBA from the Cass Business School at City University in London.
Learn More